Reviewing Social Engagement Analytics
Brightcove Social provides several reports that can be used to monitor the performance of your videos that are posted to your social media accounts:
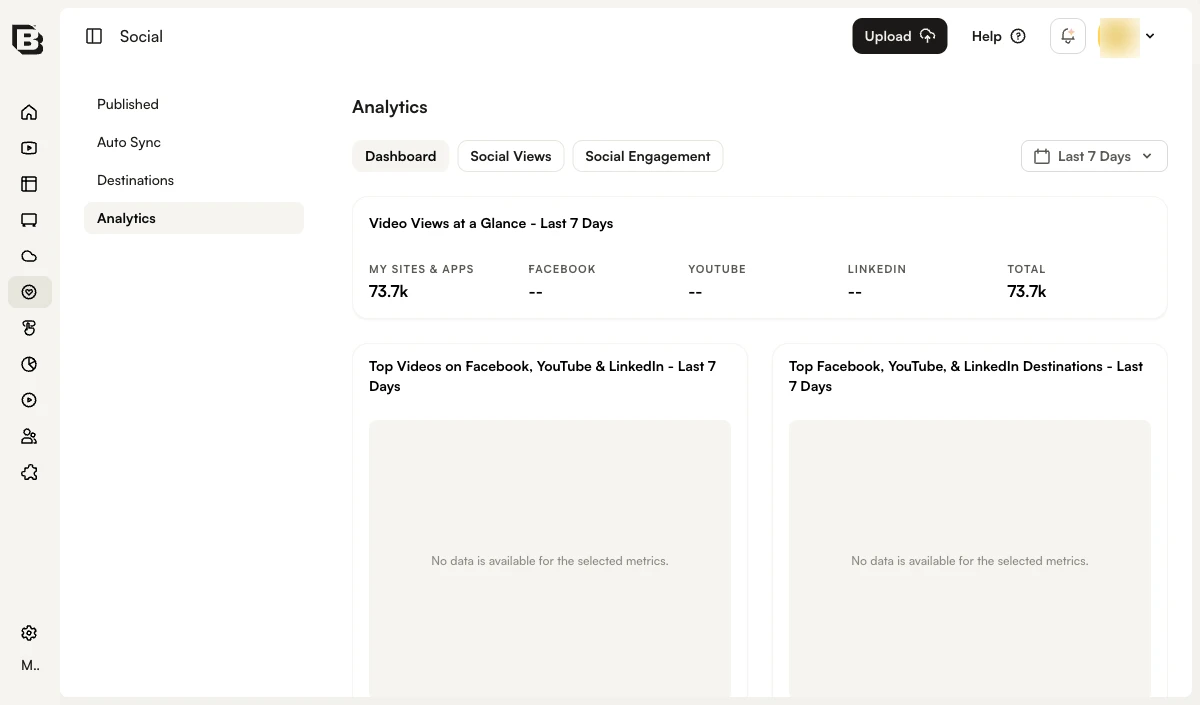
- Dashboard - Provides a high level overview of video performance on social media accounts. For information, see Reviewing Social Analytics.
- Social Views - Provides an overview of the social view for videos shared to social media accounts. For information, see Reviewing Social Views Analytics.
- Social Engagement - Provides an overview of the social engagement (Likes, Shares, Retweets, etc.) for videos shared to social media accounts. Covered in this topic.
To access the social engagement analytics, open the Social module, click Analytics in the left navigation and then click the Social Engagement tab at the top of the page.
Start by selecting a time span for the report. To view the Social Engagement Analytics Report, click the Social Engagement tab at the top of the page.
The Social Engagement Analytics Report is organized into the following sections:
Social Engagement
The Social Engagement graph will display the social engagement for the videos posted to your social media accounts for the time period selected. The Updated date is the latest date that has social analytics data for. Typically, there is a 24-48+ hour delay before social platforms update the views and engagement data in their APIs. Hovering over a line in the graph will display the data for that date.
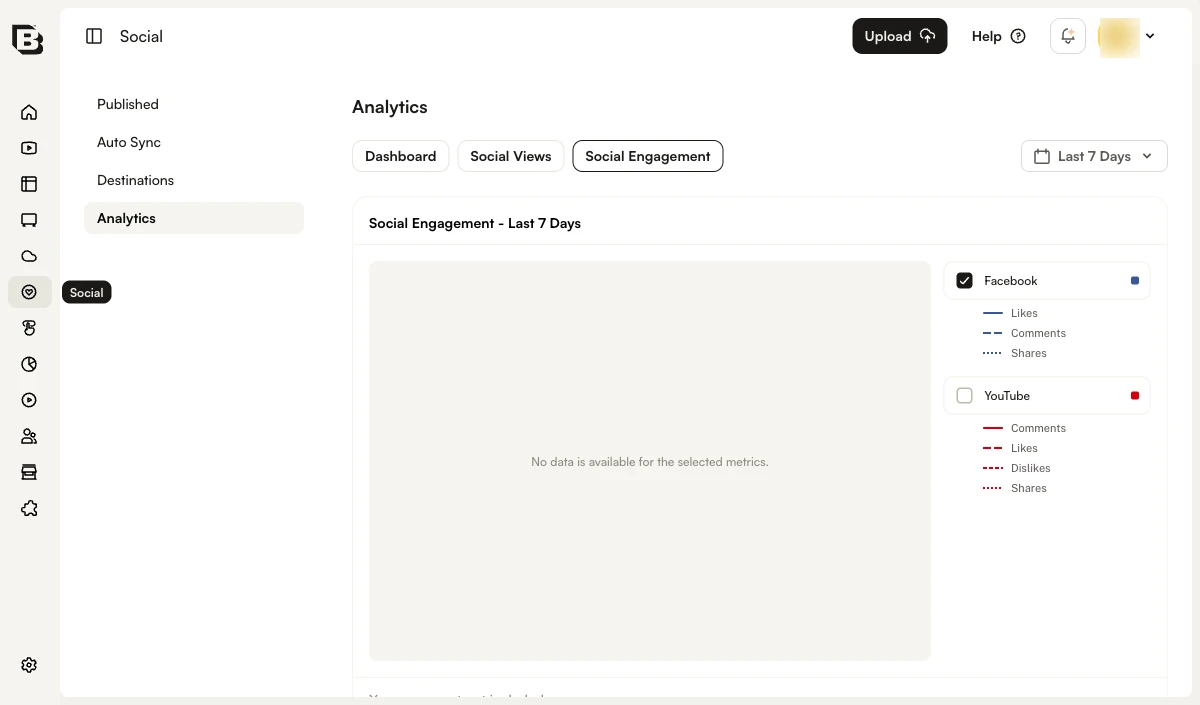
The legend to the right of the graph can be used to select the level of detail to display:
- Facebook - Display the number of Likes, Comments and Shares
- YouTube - Display the number of Comments, Likes, Dislikes and Shares
The YouTube views shown in the analytics reports are collected from the YouTube Analytics Overview report. YouTube does not guarantee that this data is real-time data. Therefore, you may see delays of several days before the views and engagement appear in this report. Once the data is in the YouTube Analytics, it will be picked up by the nightly data collectors for the Brightcove Social Analytics.
If you need more recent real-time viewing data, YouTube also provides real-time reports with estimates of viewing data during the past 48 hours for your top 25 most recently published videos. You can find the real-time report for your YouTube channel here. Brightcove Social Analytics is not collecting this real-time data since it provides estimated views (as opposed to actuals) and only applies to recent videos.
Social engagement by video
The Social engagement by video section displays the detailed engagement data for each video, with a column per destination platform (for example, YouTube and Facebook).
For each video row, the following will be displayed:
- Video name
- Created date
- Per-destination engagement totals (one column per platform in use)
The bottom of the report has controls which let you select how many rows should be displayed and for navigating to other pages.
Exporting data
Click Export above the Social engagement by video table to download the report data as comma separated values or Excel formats. Note that the export feature saves the data directly from an Analytics API call. The exported data is not manipulated the way the UI data is, and currently contains all of the underlying data in the report, not just the subset of fields the UI shows. Having all of the data in the original format from the API allows you to manipulate the data in ways other than what is provided in the UI.