Introduction
Engagement Subscribers Insights is a stand-alone product focused on the frequency and intensity of viewer activity.
The Engagement section helps you understand viewer use and patterns, including:
- How often viewers engage
- How much viewers engage
- Which devices are viewers engaging on
- How your user base is trending
If you are new to Beacon Engagement Subscribers Insights, see the Overview: Engagement Subscribers Insights for Beacon document.
Engagement tab
The Engagement tab shows you viewer engagement with your content.
- Login to Brightcove Audience Insights.
-
Select the Engagement tab.
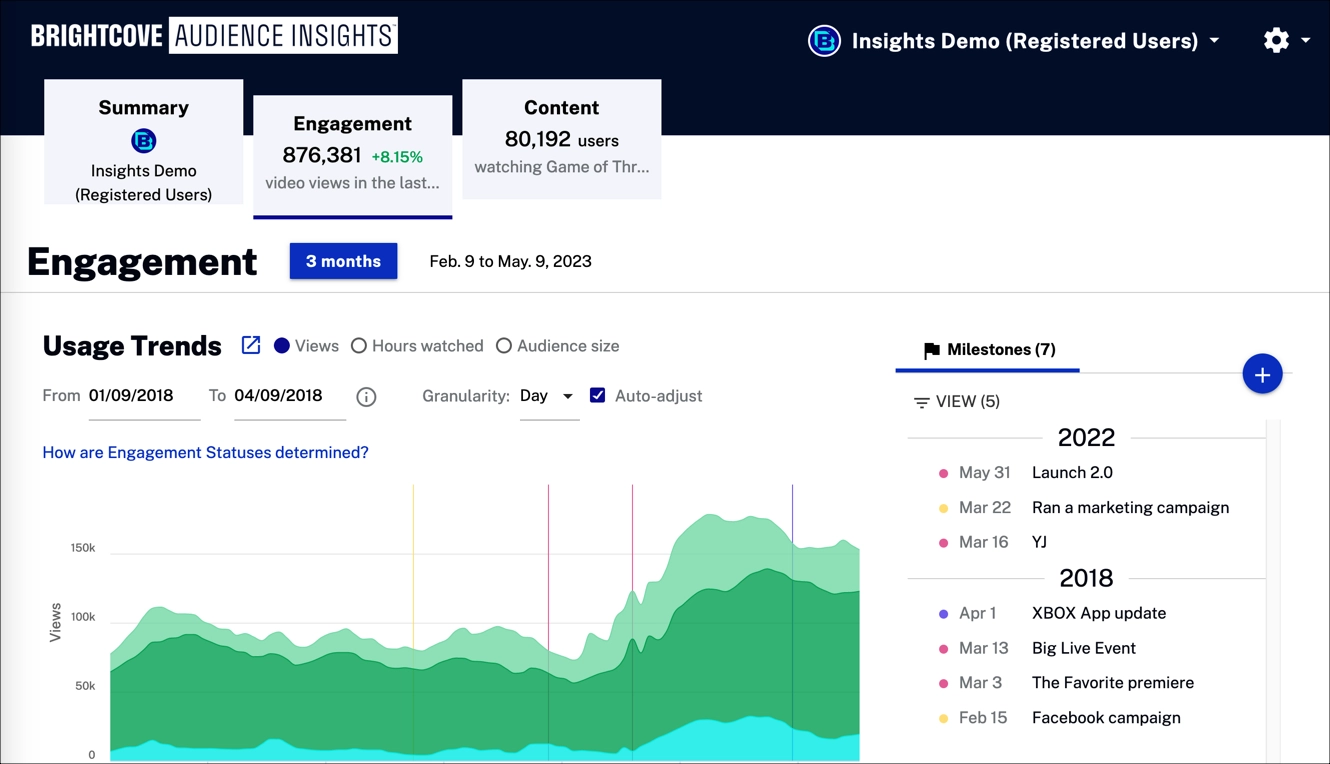
Engagement tab
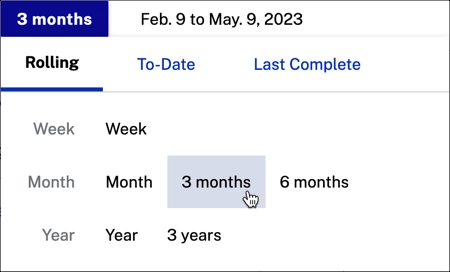
Time range
Use time range to filter the data displayed in the charts below.
Click 3 months to expand the dropdown menu. Select the time range for your reporting data. The charts below trend over time, based on the time range.
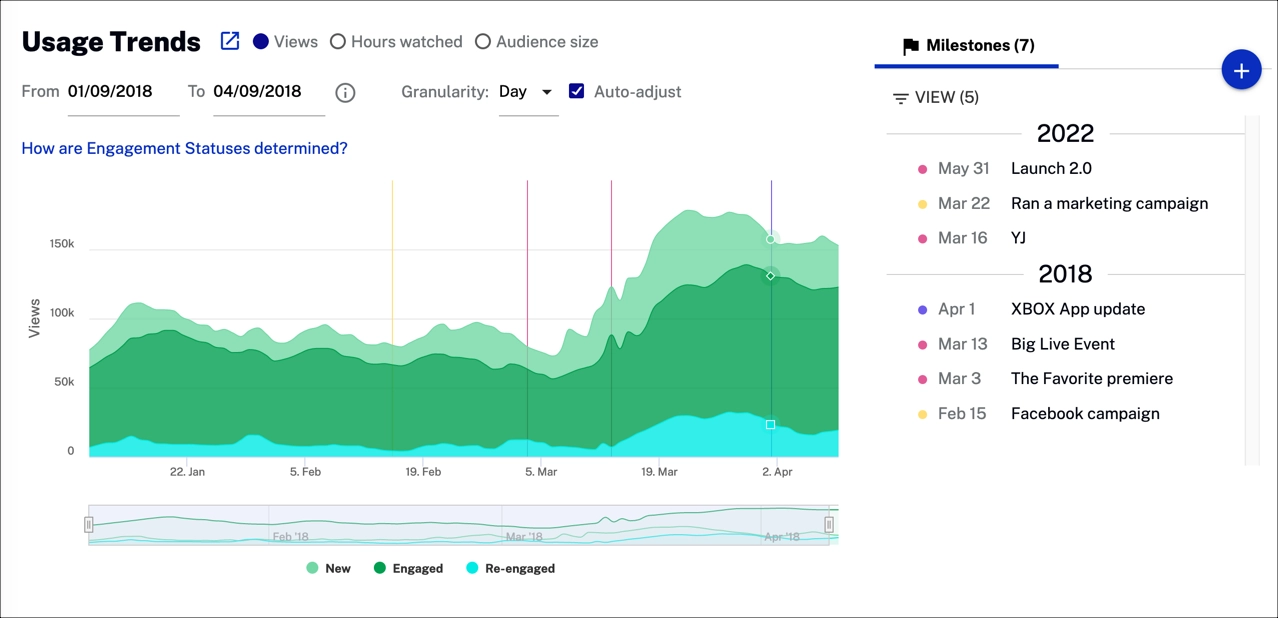
Usage trends
Usage Trends shows views, hours viewed, and audience size grouped by trialists & subscribers.
Overview
Quickly view a summary of usage trends data per day.
Review usage trends data:
- New - Users with a view in the last week but none in the last year
- Engaged - Users with multiple views in the last month; views may not have gaps longer than 28 days from previous views
- Re-engaged - Users with a view in the last week, but no views in the prior four weeks
- Recent - Users with no views in the last week but at least one view in the prior three weeks.
Actions
- Click
 to expand the graph and see more
information.
to expand the graph and see more
information.
- Select
 to see engage trends displayed by
views, hours watched or audience size.
to see engage trends displayed by
views, hours watched or audience size. - Click
 to download data as a CSV
file or a PNG image.
to download data as a CSV
file or a PNG image.

- Select a date range for your data.
- Select the x-axis granularity to be Day, Week or
Month.
- Check
 to automatically change the x-axis dimension
to day.
to automatically change the x-axis dimension
to day.
- Select
 to automatically show a specific
graphic for new, engage and re-engage.
to automatically show a specific
graphic for new, engage and re-engage.
Examples
-
Disinterested user
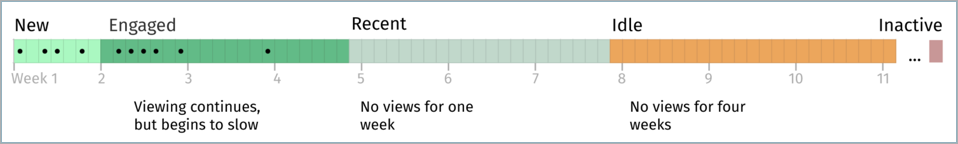
Disinterested User -
Spotty viewing
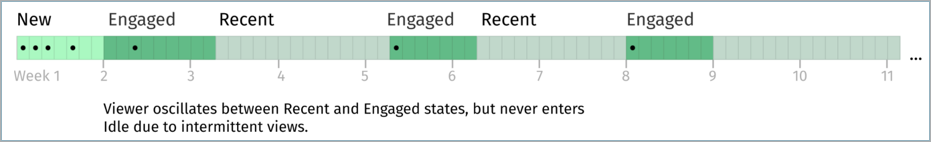
Spotty viewing -
Seasonal viewing
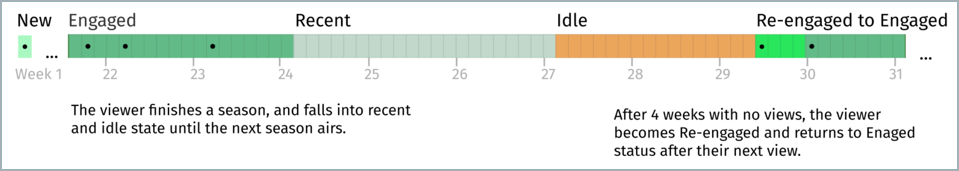
Seasonal Viewing
Milestones
Milestones track progress against your decisions and are persistent throughout each tab of the Scorecard.
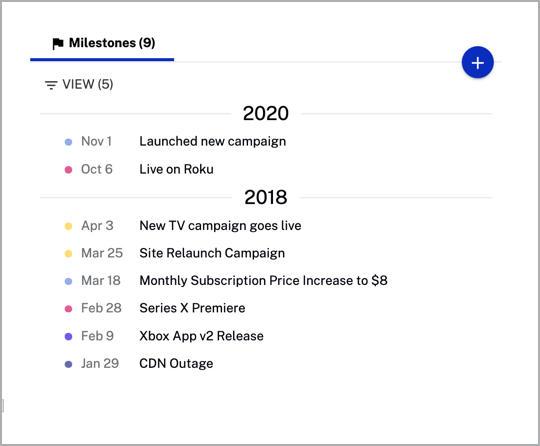
Actions
Here are the actions that are available for the milestones section.
-
Click
 to add a new
milestone.
to add a new
milestone.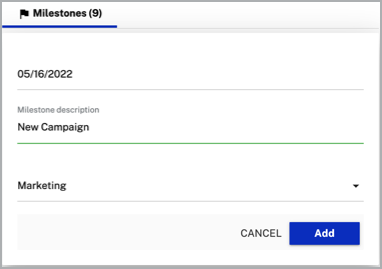
-
Click
 to delete or edit a
milestone.
to delete or edit a
milestone.
-
Click
 to select which views to show.
Engagement status over time
Engagement status over time metrics allow you to see the views, hours viewed, audience size, and sessions over time broken down by Engagement Status.
Overview
Quickly view a summary of engagement status over time data.
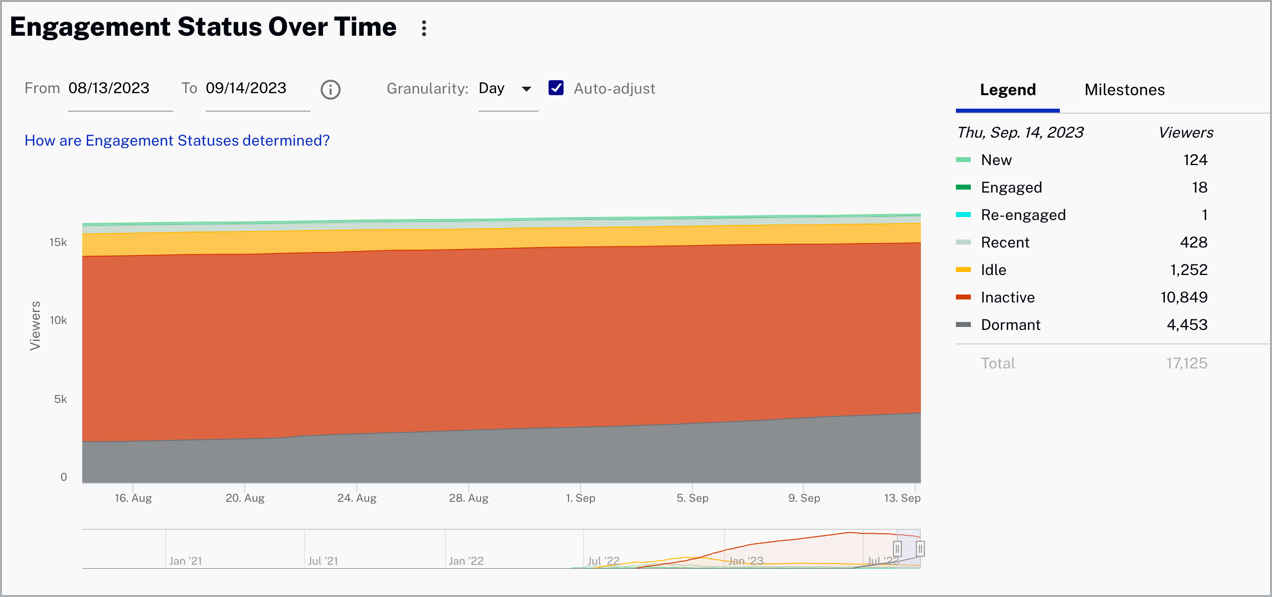
Review engagement status over time data:
- Legend - Representation of entries on the plotted area of the engagement status over time graph
- New - Users with a view in the last week but none in the last year
- Engaged - Users with multiple views last month; views may not have gaps longer than 28 days from previous views
- Re-engaged - Users with a view in the last week but no views in the prior four weeks
- Recent - Users with no views in the last week but at least one view in the prior three weeks.
- Idle - Users with no views in the last four weeks but at least one view in the prior eight weeks
- Inactive - Users with no views in the last 12 weeks but at least one view in the last year
- Dormant - Users with no views in the last year
Actions
Here are the actions that are available for this graph.
-
Click
to download data as a CSV
file or a PNG image.
Select a date range for your data.
Select the x-axis granularity to be Day, Week or Month.
- Check to automatically change the x-axis dimension
to day.
- Hover over the legend section to see the specific data by New, Engaged, Re-engaged, Recent, Idle, Inactive, and Dormant.
Examples
-
Disinterested user
Disinterested User -
Spotty viewing
Spotty viewing -
Seasonal viewing
Seasonal Viewing
Key metrics
The key metrics provide a unified view of your video data.
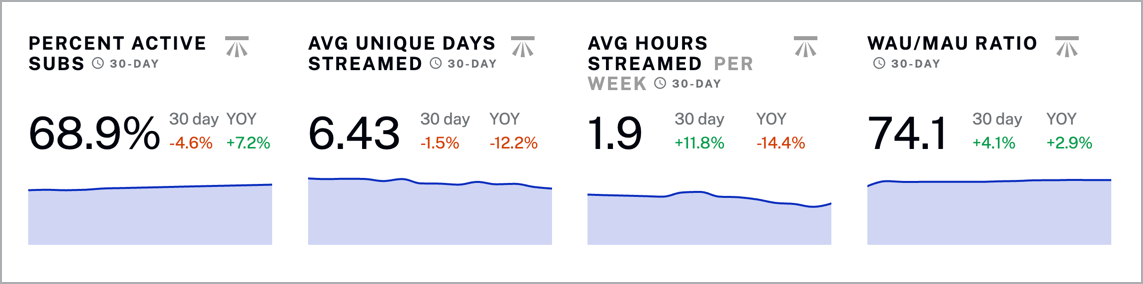
Review key metrics data:
- Percent active subs - Percentage of your paid subscriptions active
- Avg unique days streamed - Average unique days stramed for a user
- Avg hours streamed per week - Average number of hours streamed per week for a user
- WAU/MAU ratio - Weekly Active Users (WAU) as a percentage of Monthly Active Users (MAU); active users are defined as being signed in
Actions
- Click
 to show benchmark data.
- Click to download data as a CSV
file or a PNG image.
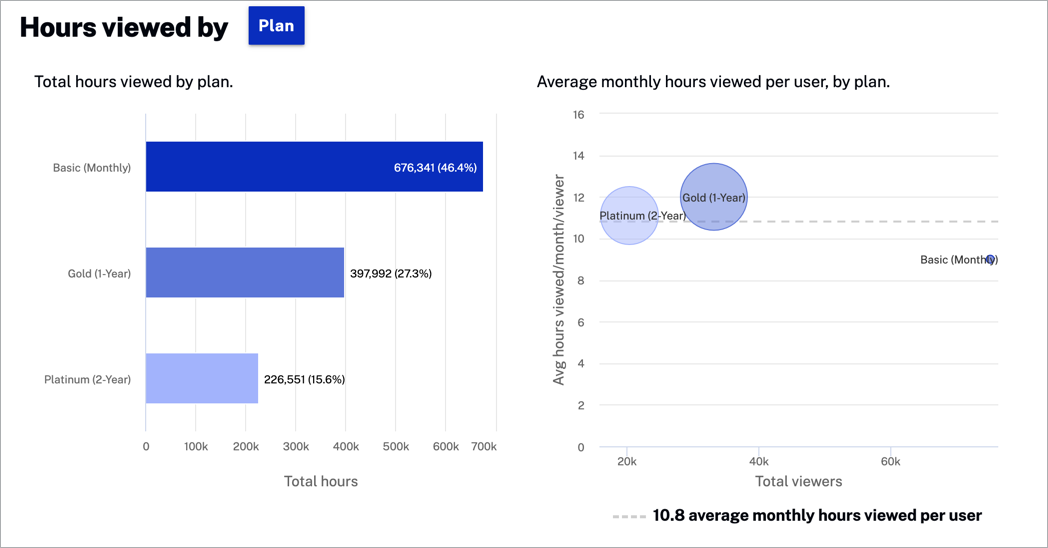
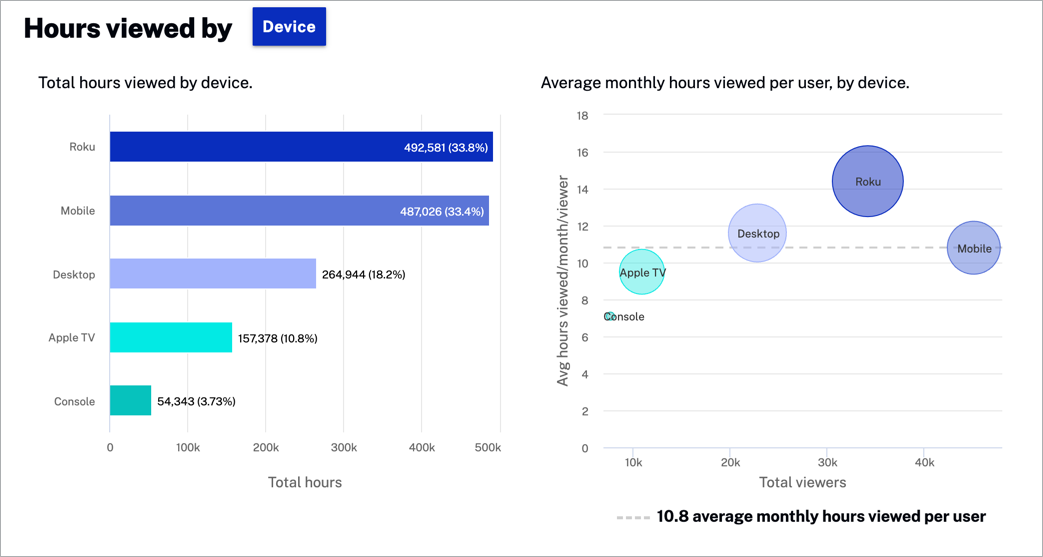
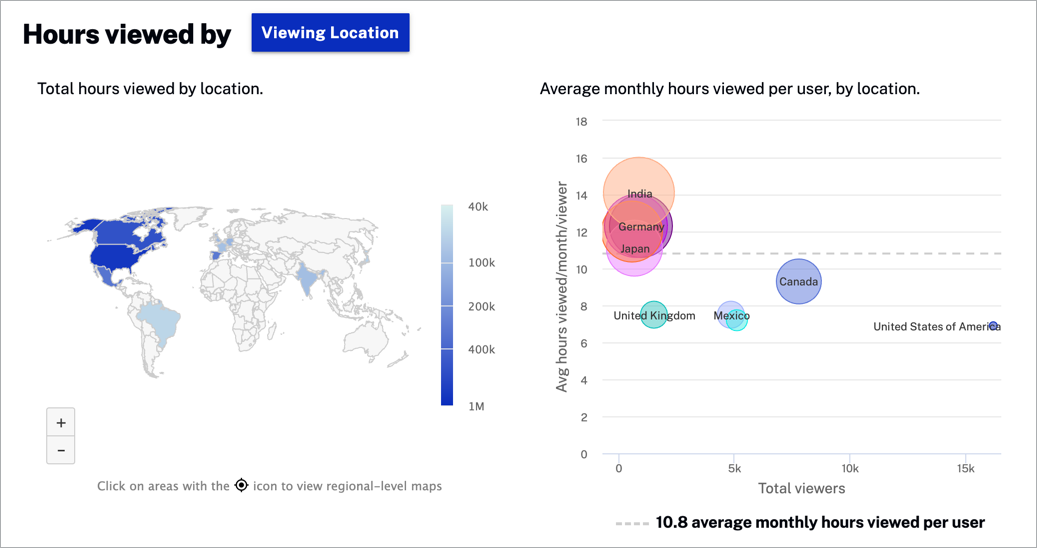
Hours viewed by category
Hours viewed metrics allow you to see the hours viewed by Plan, Channel, Device, and Viewing Location.
In the Hours Viewed By section, click the Device button to select a category for your reporting data.

When you click the following options, different charts will be displayed.
-
Plan
-
Device
-
Viewing location
Actions
Here are the actions that are available for this graph.
-
Click
 to download data as PNG image
or
PDF.
to download data as PNG image
or
PDF.
-
Click
 to zoom in or out the graphic.
Average hours viewed by category
The average hours viewed per week by metrics provide a unified view of the hours viewed per user by plan, device, channel, and location with country or region.
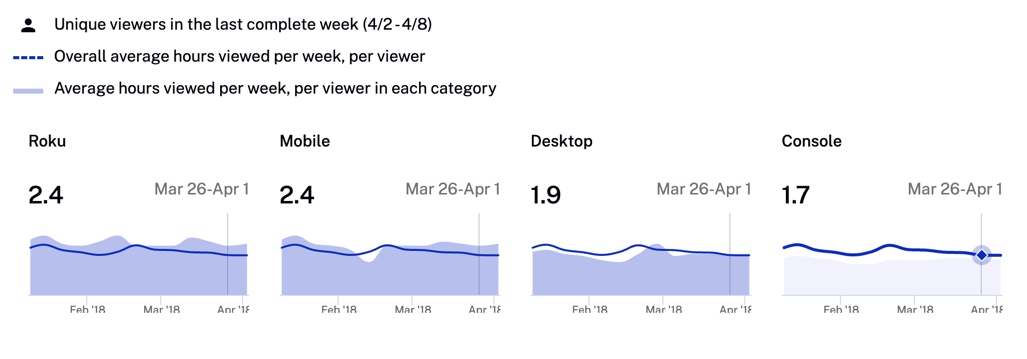
Review usage trends data:
- Unique viewers - Users with a view in the last copmplete week
- Overall average hours - Average of hours viewed per week and viewer
- Average hours viewed per week - Average of hours viewed per week in each category
Actions
Here are the actions that are available for this section.
Click
 to show the data by plan, device, channel, and location with country or region.
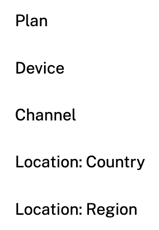
Click
 to display the detailed chart.
Sessions over time
Engagement sessions over time metrics allows you to see the new, engaged, re-engaged, and the average duration in minutes data.
Overview
Quickly view a summary of sessions over time data.
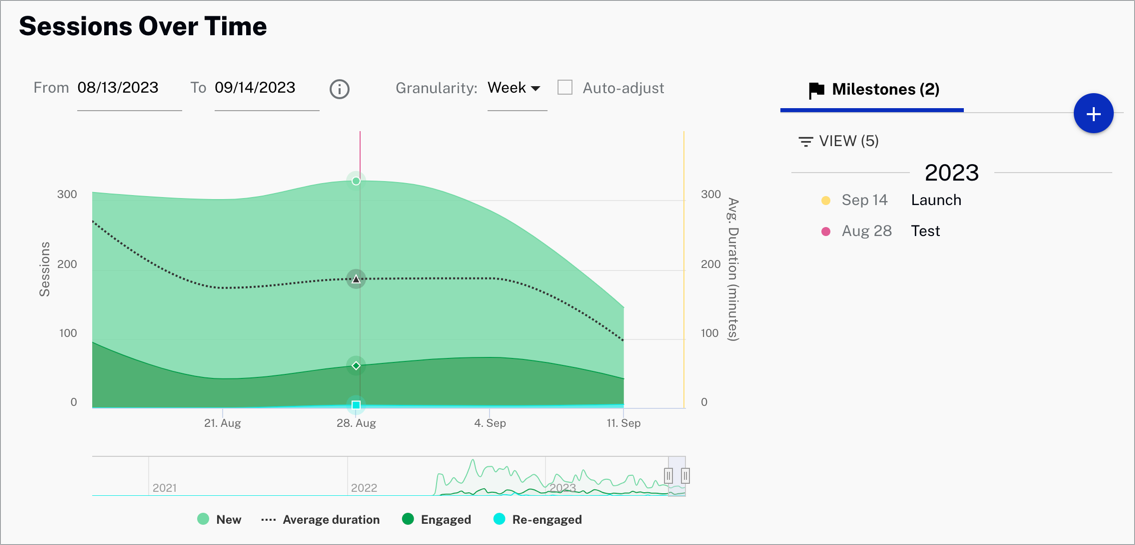
Review usage trends data:
- New - Users with a view in the last week but none in the last year
- Engaged - Users with multiple views in the last month. Views may not have gaps longer than 28 days from previous views
- Re-engaged - Users with a view in the last week, but no views in the prior four weeks
- Average duration - Average duration in minutes per session
Actions
Here are the actions that are available for this graph.
-
Click
to download data as a CSV
file or a PNG image.
Select a date range for your data.
Select the x-axis granularity to be Day, Week or Month.
- Check to automatically change the x-axis dimension
to day.