Introduction
Engagement Subscribers Insights is a stand-alone product focused on the frequency and intensity of viewer activity.
The Summary reports provide quick insights into the following:
- Number of views and active viewers
- A quick view of content performance
- Which titles are driving traffic
- Top series, top movies, top genres, and hours viewed by device
- The content viewers watch when the first come to your site
If you are new to Beacon Engagement Subscribers Insights, see the Overview: Engagement Subscribers Insights for Beacon document.
Summary tab
The Summary tab provides an overview of reports you can deliver to your executive team. The report data displays weekly timeframes, where you select the week of interest. These summary reports save you time from building your own reports.
- Login to Brightcove Audience Insights.
-
The Summary tab will be selected by default.
Summary
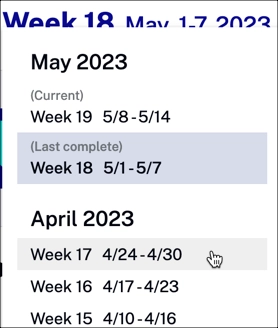
Time range
Use time range to filter the data displayed in the charts below.
Expand the Week dropdown menu. Leave the Last complete week selected, or choose a different week for your reporting data. The charts below trend over time, based on the time range.
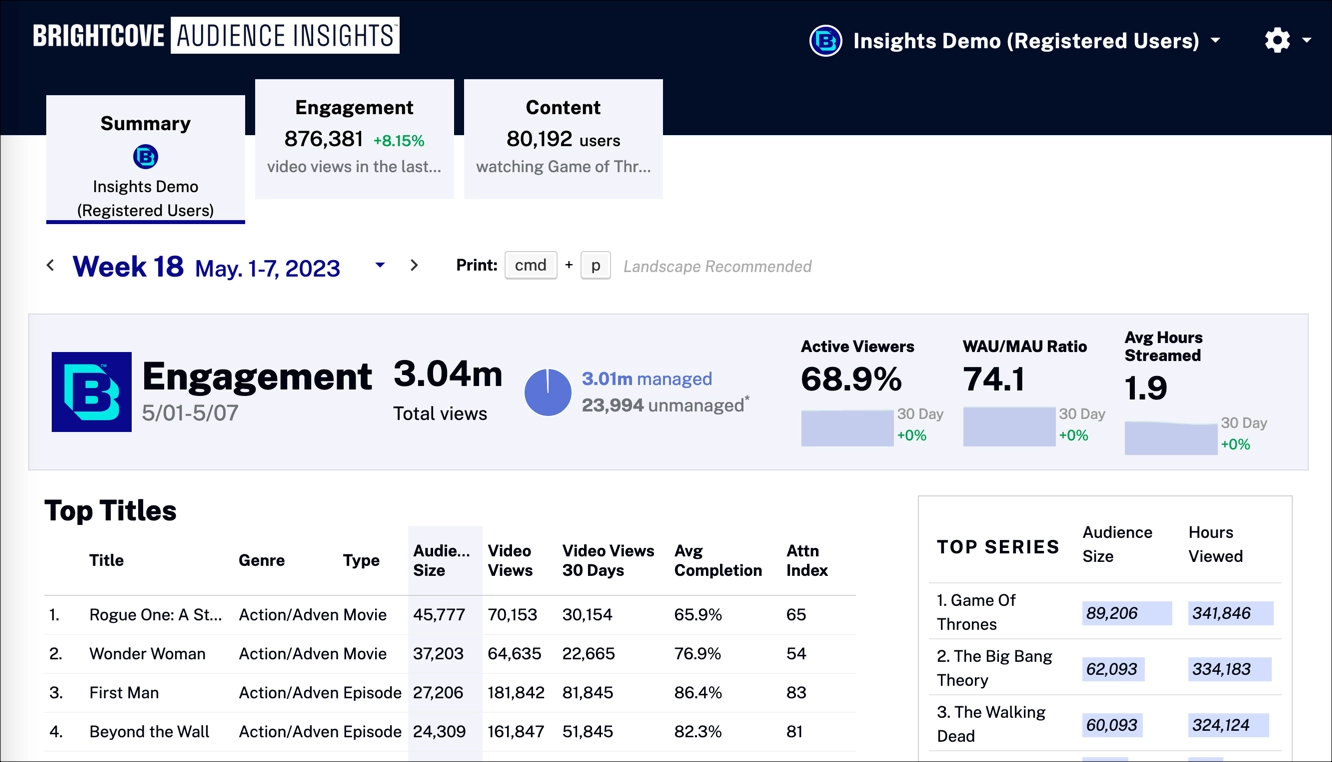
Engagement
The following quick-view graphs provide insights into customer value for the selected week. It shows the number of views, active viewers, and a quick view of content performance.

Data
Graph data:
- Engagement - Timeframe for customer engagement data
- Total views - Total customer views for all of your content
- managed/unmanaged -Systems without user-specific data reporting (i.e. Amazon Channels) are unmanaged; data from these services are not presented in any charts
- Active Viewers - Percentage of the total number of viewers who were active in the last 30 days
- WAU/MAU Ratio - Weekly Active Users (WAU) as a percentage of Monthly Active Users (MAU); active users are defined as being signed in
- Avg Hours Streamed - The average number of hours streamed for a user
Top Titles
This table shows which titles in your content library are driving the most traffic.
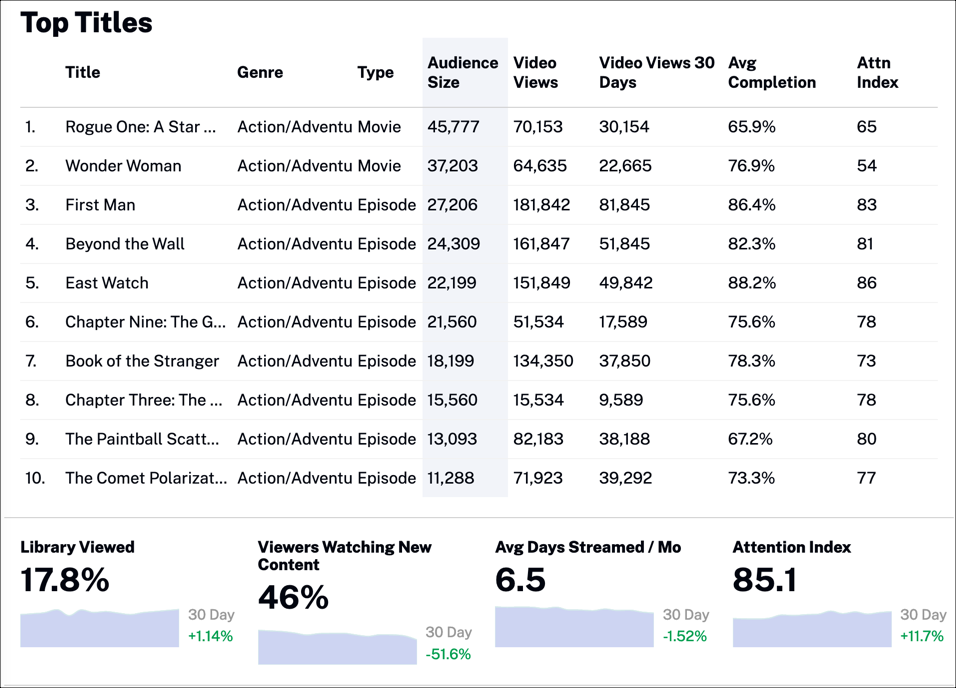
Data
Table data:
- Title - Title of the content viewed
- Genre - Stylistic or thematic category for grouping video content
- Type - Type of video content or group of content; values are Series, Season, Episode, Movie
- Audience Size - Number of unique viewers
- Video Views - Number of times a video started playing, recorded when the stream is started (does not include rewind or replay); it is not a measure of individual viewers
- Video Views 30 Days - Number of video views for the past 30 days
- Avg Completion - Average percentage of the amount of video content viewed by each user
- Attn Index -
Graph data:
- Library Viewed - Percentage of your video library viewed by all customers
- Viewers Watching New Content - Percentage of viewers watching new video content
- Avg Days Streamed / Mo - Average number of days streamed per user for the past 30 days
- Attention Index -
Top Series, Movies, Genres, Live channels
These tables show the top series, movies, genres, and live channels based on video views.
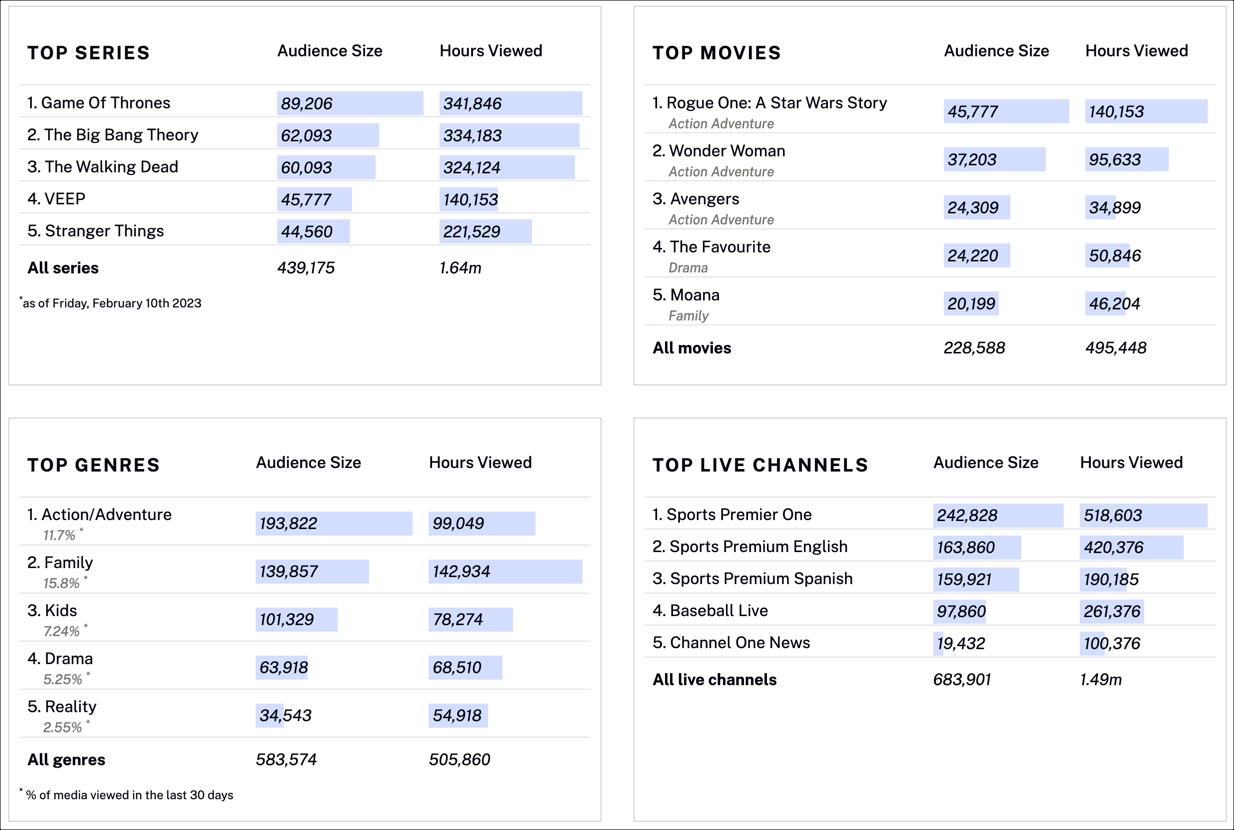
Data
Table data:
- Audience Size - Total number of viewers
- Hours Viewed - Total number of hours viewed by all viewers
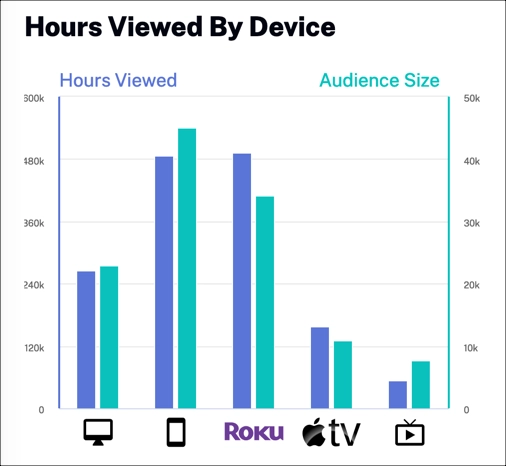
Hours Viewed by Device
See which devices are most popular by your viewers.
Data
Graph data:
- Hours Viewed - Number of hours viewed by device
- Audience Size - Number of viewers by device
- Device - Device used by viewers to watch your content; includes desktop, phone, Roku, Apple TV, other TV
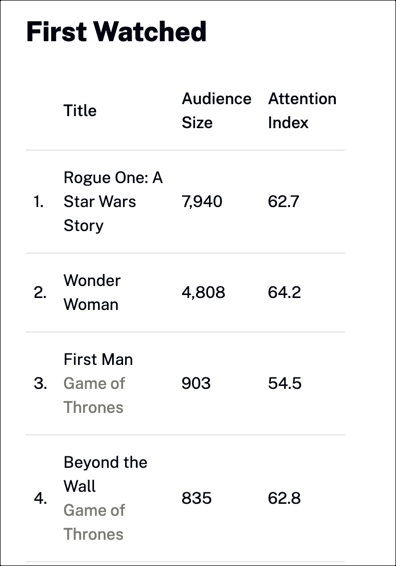
First Watched
See what content viewers watch when they first come to your site. This content gives you insight into what drove the viewer to your site.
Data
Table data:
- Title - Name of your video content
- Audience Size - Total number of viewers
- Attention Index -