Introduction
To learn about the audience for your Brightcove apps, you can use Google Analytics. To get you started, Brightcove will load the following into your Google Analytics account:
- A customized report template for Google Looker Studio
Looker Studio
Looker Studio, a part of the Google Marketing Platform, is an online tool for visualizing analytics data in customizable reports and dashboards. Looker Studio offers features including:
- Data Visualization - Create interactive charts, diagrams, and tables
- Integration with Data Sources - Integrate from different data channels using partner connectors
- Teamwork - Collaborate by sharing dashboards among team members
For more details, see Google's Looker Studio homepage.
Google Analytics
In addition to Looker Studio, you can use the standard analytics tools in Google Analytics to view customer behavior.
Viewing the Looker Studio report
Use Looker Studio to turn your data into data visualization stories, which include interactive reports and dashboards.
To view the customized Google Looker Studio report installed by Brightcove, follow these steps:
- Log in to Google Looker Studio.
- You will see a list of reports on the landing page:
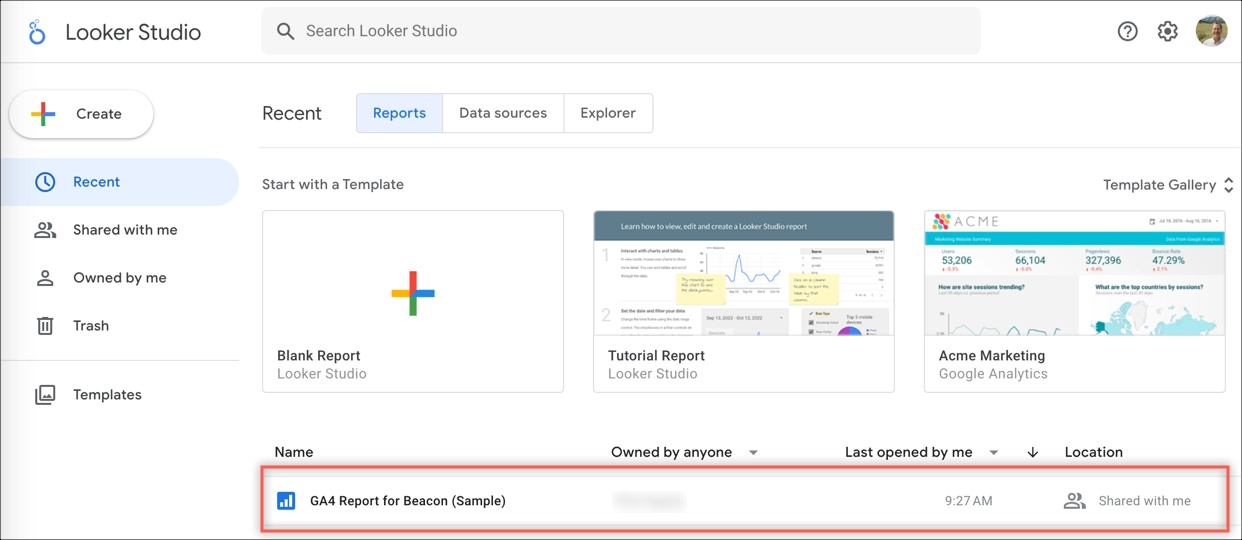
- Click on a report name to open it.
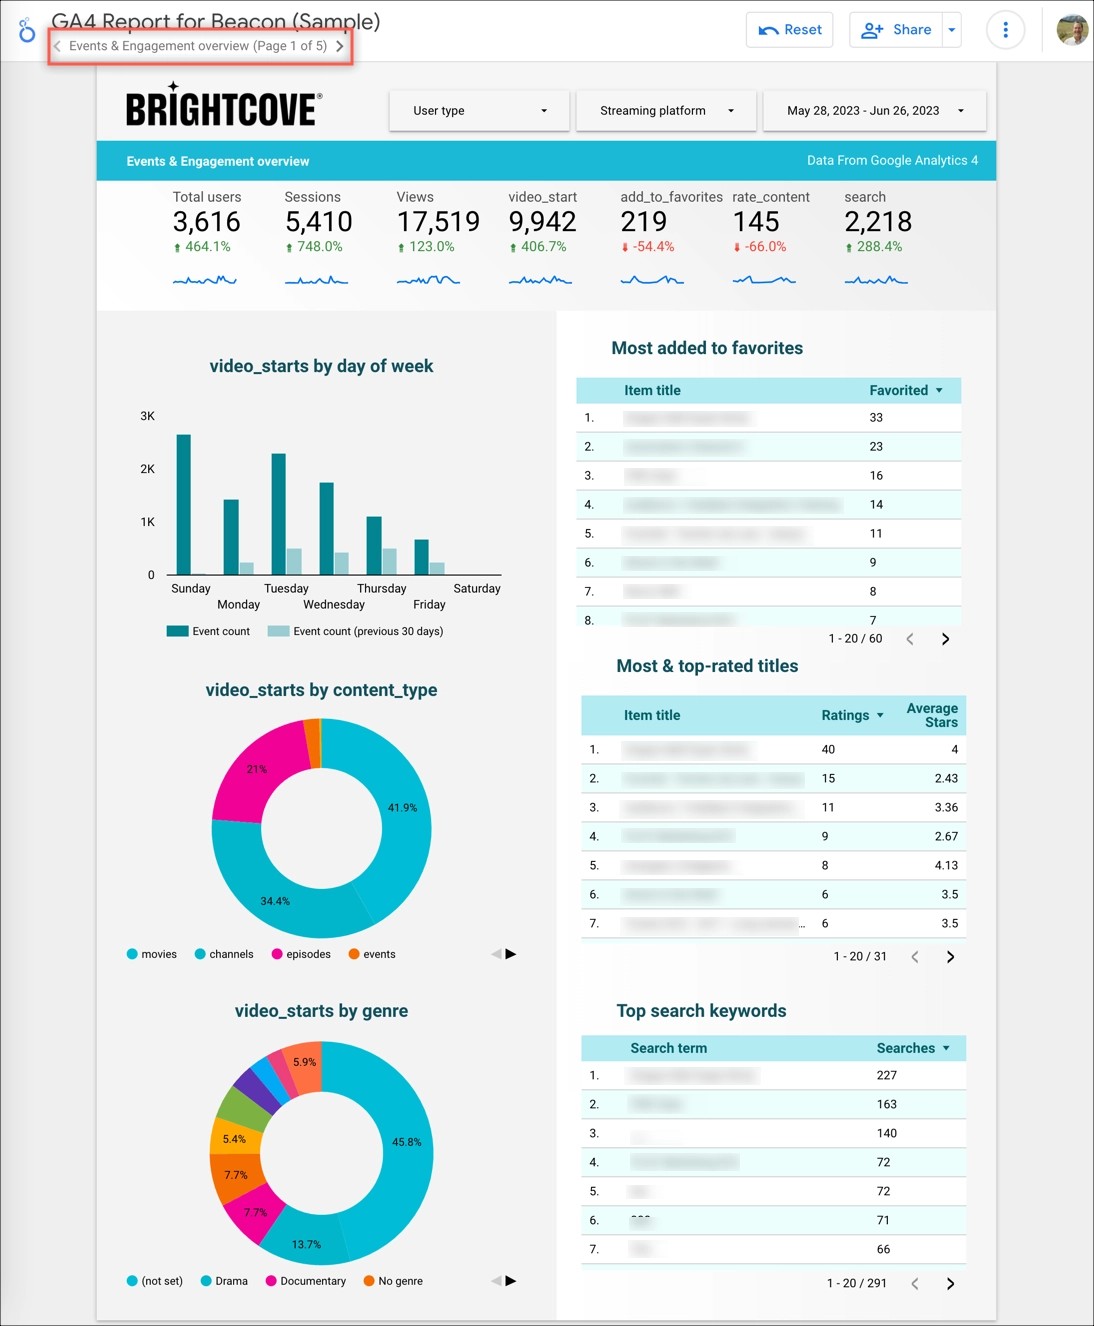
- The first page of an example report is shown here.
Viewing dimensions and metrics
You can view dimensions associated with your Brightcove apps within Google Analytics.
For details on how to configure these dimensions and metrics, see the Google Analytics Self Configuration with Beacon document.
- Log in to Google Analytics.
- Click on the accounts dropdown menu to see all your Google Analytics accounts.

- From the three-paneled dropdown, select:
- Your Brightcove account
- Your app for which you want analytics

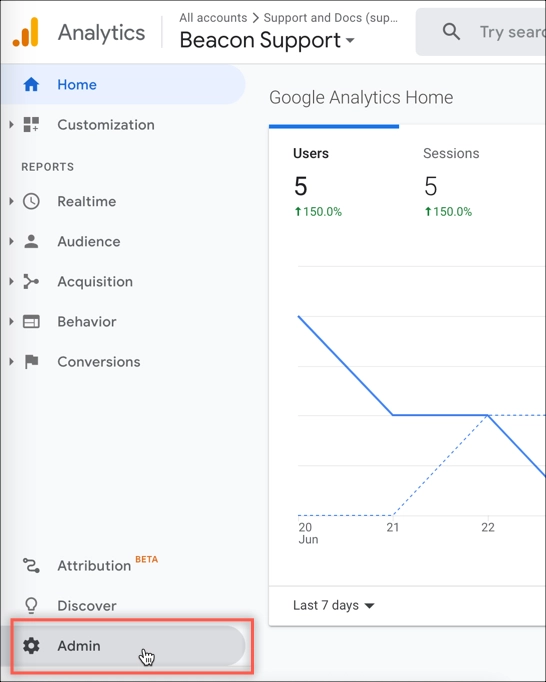
- In the left side navigation, click the Admin option.
- Click Custom definitions.
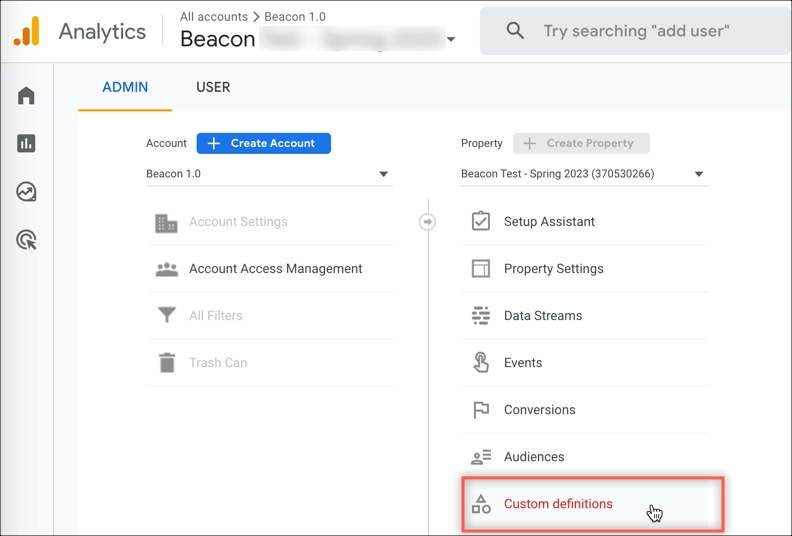
- Click the Custom dimensions tab to see the dimensions for this app. Dimensions change per app.
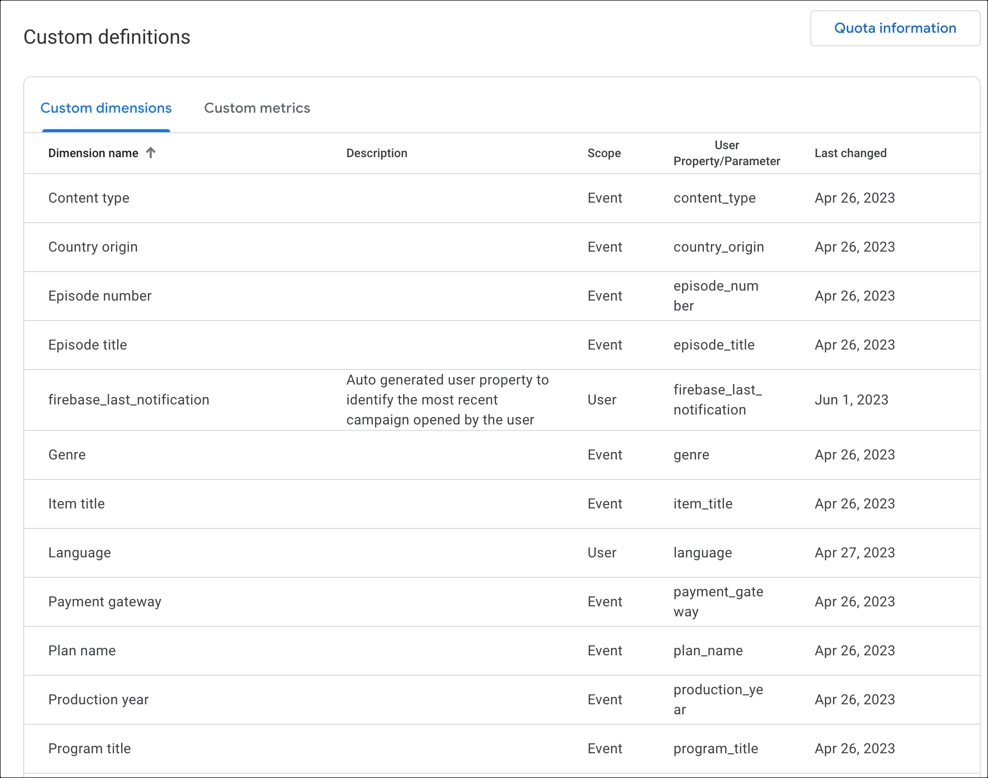
- Click the Custom metrics tab to see the single metic, Stars. This is the only custom metric for Brightcove apps.

Events and parameters
The following events and parameters are reported to Google Analytics by your Brightcove apps.
Events Reported to Google Analytics
| Platform | Event name | Description | Parameters |
|---|---|---|---|
| All | loading |
Loading the app: loading method |
User Properties : user_type, languageEvent Parameters: streaming_platform
|
| All | sign_up |
When a user has signed up - Only applicable with Beacon Auth |
User Properties : user_type, languageEvent Parameters: streaming_platform
|
| All | login |
When a user logins a Beacon App |
User Properties : user_type, languageEvent Parameters: streaming_platform
|
| All | video_start |
When a user first starts a video - Applies only to video loaded on screen, across all players/locations in the apps. |
User Properties : user_type, languageEvent Parameters: streaming_platform, content_type, item_title, genre, production_year, country_originFor Episodes: episode_number, season_number, episode_titleFor Channels: program_title
|
| All | add_to_favorites |
When a user adds a video to the favorites list |
User Properties : user_type, languageEvent Parameters: streaming_platform, content_type, item_title, genre, production_year, country_origin
|
| All | rate_content |
User rates an asset in the app |
User Properties : user_type, languageEvent Parameters: streaming_platform, content_type, item_title, genre, production_year, country_origin, stars
|
| All | search |
When a user performs a site search |
User Properties : user_type, languageEvent Parameters: streaming_platform, search_term
|
| All | subscribe |
when a user subscribes to a package |
User Properties : user_type, languageEvent Parameters: streaming_platform, plan_name, payment_gateway, value, currency
|
| iOS / Android | screen_view |
User Properties : user_type, languageEvent Parameters: streaming_platform, screen_name
|
|
| Web / STV | page_view |
streaming_platform, page_title
|
|
| Web / iOS / Android | user_engagement |
When the app is in the foreground or webpage is in focus for at least one second |
engagement_time_msec
|
| Web / iOS / Android | session_start |
When a user engages the app or website A session ID and session number are generated automatically with each session and associated with each event in the session. Learn more |
|
| Web / iOS / Android | first_visit |
The first time a user visits a website or launches an Android instant app with Analytics enabledh each event in the session. Learn more | |
| Web / iOS / Android | first_open |
The first time a user launches an app after installing or re-installing it This event is not triggered when a user downloads the app onto a device, but instead when he or she first uses it. To see raw download numbers, look in Google Play Developer Console or in AppStoreConnect. Supports measuring first_open conversions for users who accept Apple's iOS 14 app-tracking prompt. |
previous_gmp_app_id, updated_with_analytics, previous_first_open_count, system_app, system_app_update, deferred_analytics_collection, reset_analytics_cause, engagement_time_msec
|
| Web | form_start |
the first time a user interacts with a form in a session |
form_id, form_name, form_destination
|
| Android | app_remove |
When an application package is removed (uninstalled) from an Android device Android only |
|
| Web / iOS / Android | app_store_subs |
When a paid subscription is renewed This event is set as a default conversion Requires an initial subscription that was made on or after July 1, 2019 This event is not exported to BigQuery |
product_id, price, value, currency, quantity, renewal_count
|
Parameters Reported to Google Analytics
| Parameter | Values | Description |
|---|---|---|
user_type |
Authenticated User, Trialist, Visitor, Subscriber
|
Visitor: Anonymous usersAuthenticated User: Authenticated user with no active subscriptionTrialist: Authenticated user with a subscription in Trial statusSubscriber: Authenticated user with an active subscription (not in trial status)
|
streaming_platform |
Android, iOS, Web, roku, firetv, androidtv, AppleTV, samsung_tizen, webos
|
|
content_type |
movies, channels, episodes, events, series
|
|
genre |
Based on customer metadata assigned to the assets | Only the first genre of each asset is sent to GA4 reports |
Google Analytics Explorations
You can use Google Analytics Explorations to discover deeper insights about your customers' behavior. For details, see Google's Get started with Explorations document.
- Return to your Google Analytics homepage.
- In the left navigation, click Explore.
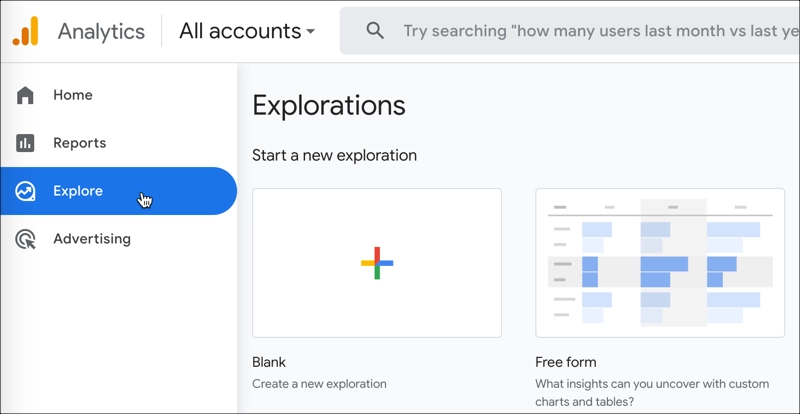
- Create a new Exploration.
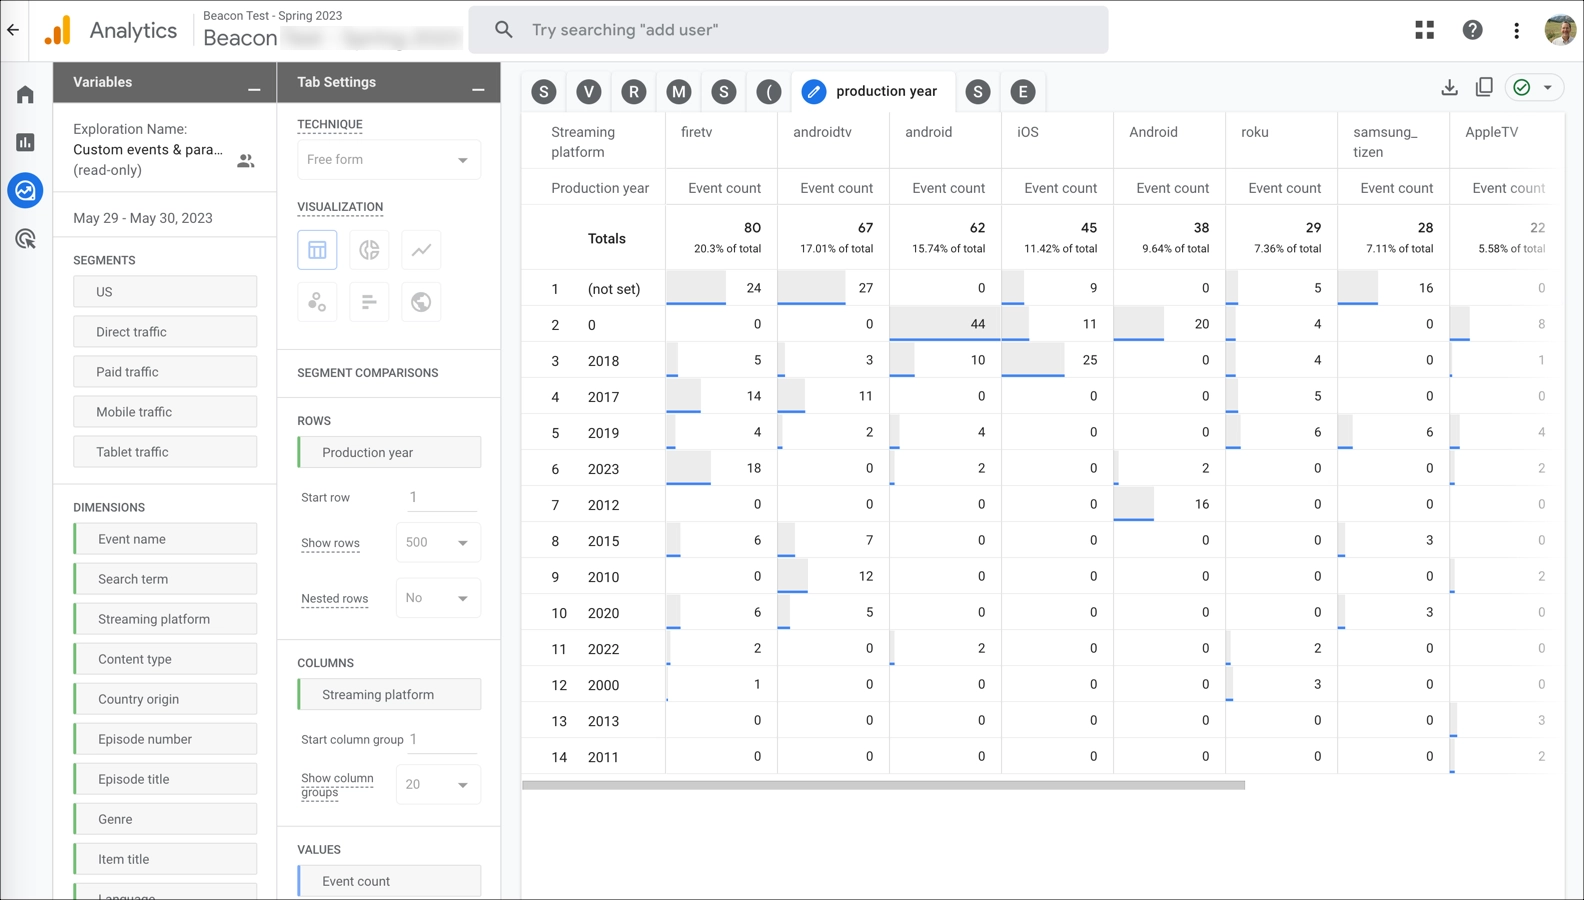
- Here is an example using events and parameters.
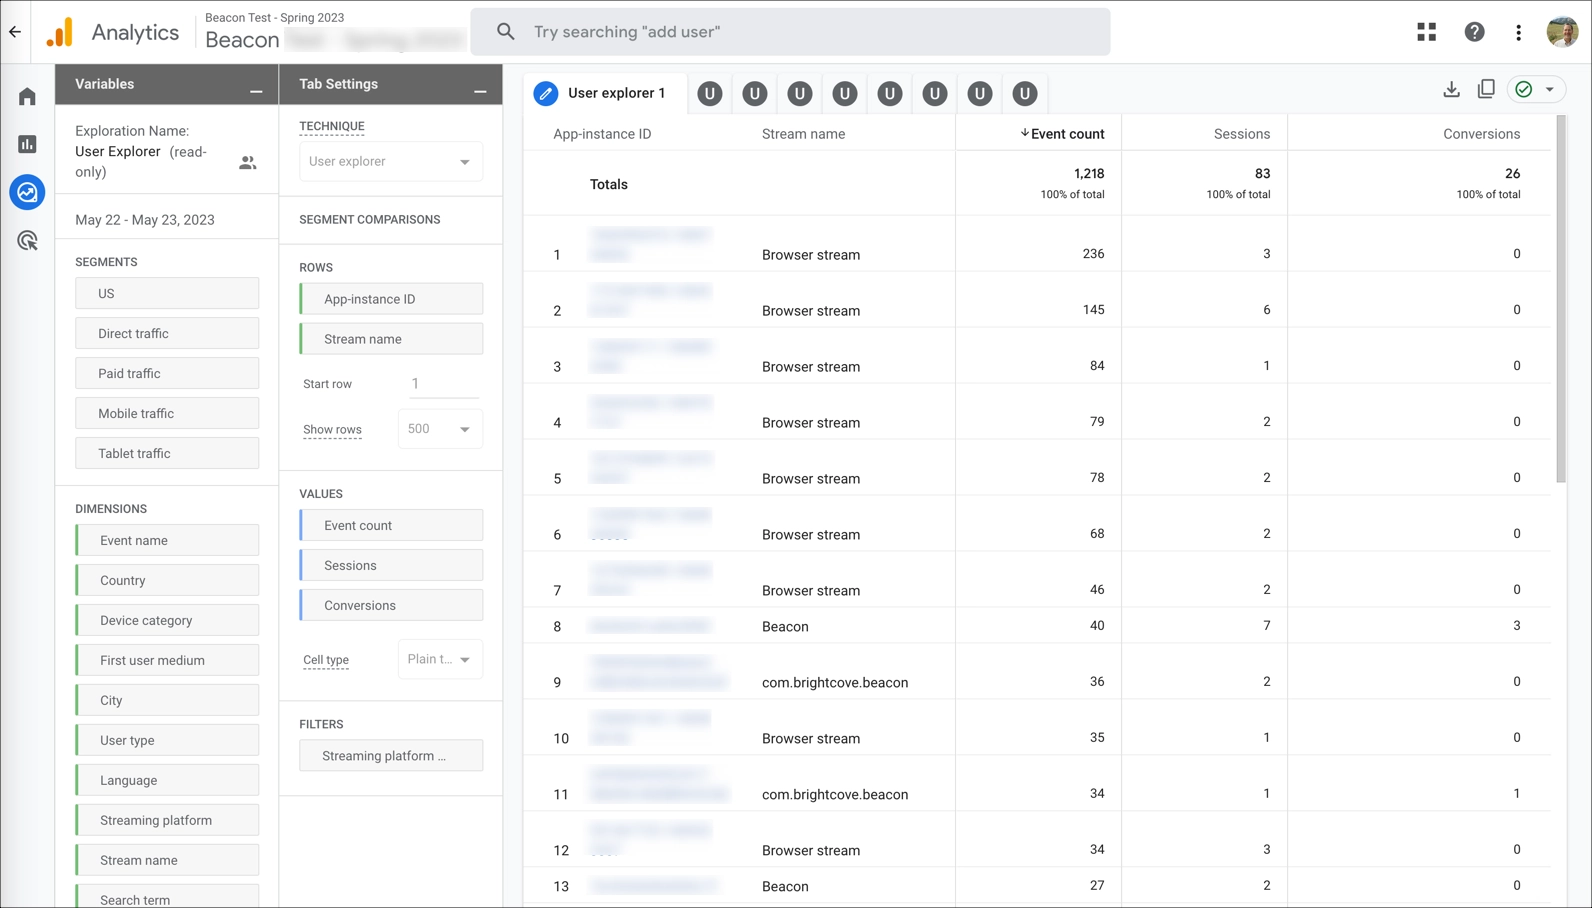
- Here is an example to provide insights about user behavior.
Google Analytics learning resources
You have just scratched the surface of Google Analytics in this document. You can put together custom reports with daily or weekly summary information on selected assets, etc. A good place to start your journey of learning more about Google Analytics could be the Google Analytics 4 classes and/or the Google Analytics documentation.
