Interactivity Reports Reference
The Analytics module provides a set of Interactivity reports that can be used to view statistics on projects, experiences and how users have interacted with annotations. The following Interactivity reports are available:
The reports can be viewed by opening the Analytics module and then by locating the Interactivity section in the left navigation. A summary of each of these reports is described in the following sections.
Core reports
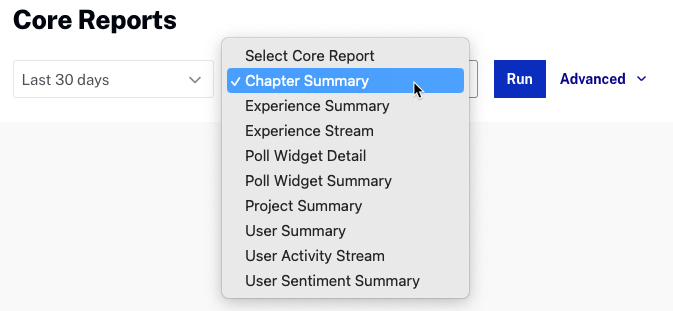
The Core reports are a series of reports that show interaction data rolled up by video (project) or by viewer. They show which videos are most engaging and which viewers are most engaged. The following Core reports are available:
- Chapter Summary - Displays all projects with chapters
- Experience Summary - Displays one row per experience and shows the viewer engagement with videos
- Experience Stream - Displays details for user interactions with experiences
- Poll Widget Detail - Displays information on poll submissions
- Poll Widget Summary - Display a summary of responses to each poll response
- Project Summary - Shows which interactive videos viewers are engaging with most
- User Summary - Displays an aggregate summary of the overall behavior of each user across each project that they viewed
- User Activity Stream - Shows an event-by-event rundown of each action a viewer takes
- User Sentiment Summary - Shows the results of the user summary widgets

For detailed information on the Core reports, see the Core Reports Reference.
Question report
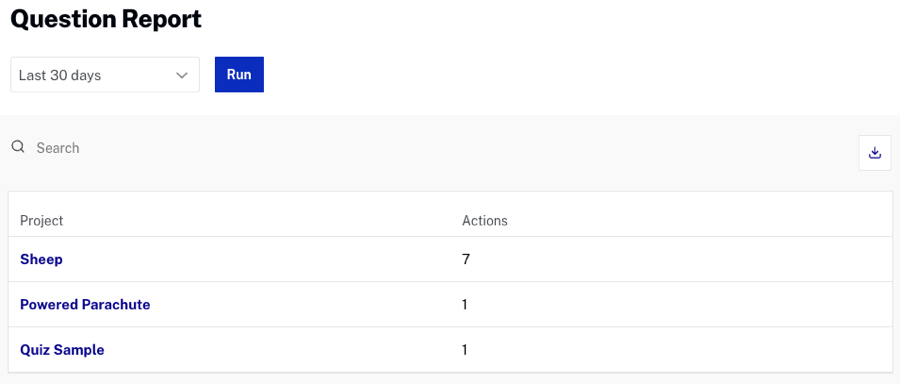
The Question report provides a summary of how all viewers have answered quiz annotations on each project.

For detailed information on the Question report, see the Question Report Reference.
Gradebook
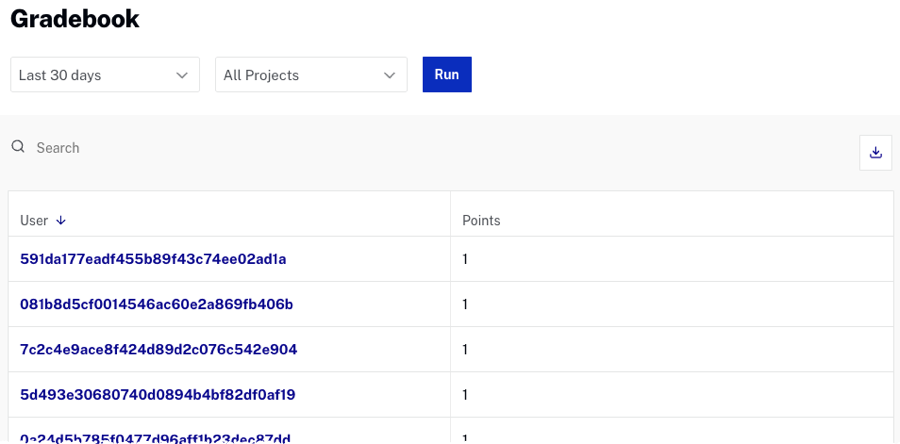
The Gradebook report provides a roll up of how each viewer has answered quiz annotations on each project.

For detailed information on the Gradebook report, see the Gradebook Report Reference.
