Core Reports Reference
The Core reports are a series of reports that show interaction data rolled up by video (project) or by viewer. They show which videos are most engaging and which viewers are most engaged.
The following Interactivity reports are also available:
The Core reports can be viewed by opening the Analytics module and then by clicking the Interactivity > Core Reports link in the left navigation.
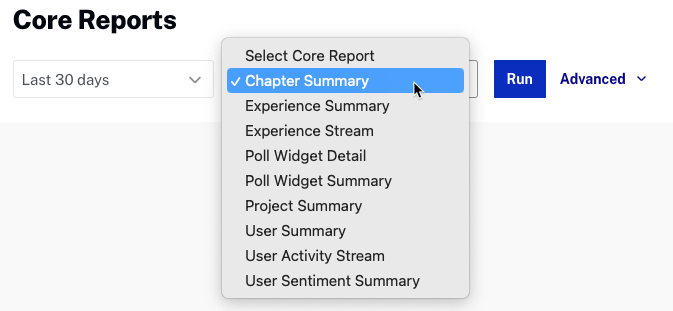
Use the date selector to specify the time period for the report, you can select a fixed date range or select a custom date range.
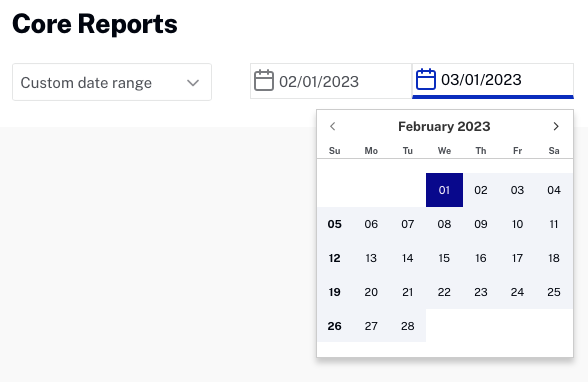
Click to run the report. Click Advanced to filter the report results by Project or Experience ID. A single ID or a comma separated list is supported.
All of the reports offer the ability to download the report data by clicking download  .
.
A summary of each of these reports is described in the following sections.
Chapter Summary
The Chapter Summary report displays all projects with chapters. The report will display:
- Project - Project title
- ID - Project ID
- Chapter Title - Chapter title
- Chapter Time - Chapter start time
- Views - Number of views of that part of the video (passed by the chapter marker during normal playback)
- Clicks - Number of times the chapter name was clicked in the chapter menu

Experience Summary
The Experience Summary report displays one row per experience and shows the viewer engagement with videos. The report will display:
- Experience name - Name of the experience
- Play Rate - Number of plays divided by the number of times the experience was loaded and ready for playback
- Interaction Rate - Plays with interaction divided by total plays (which could not have any interaction). Interaction is usage of any of the interactive elements (play button, volume, etc do not count - but passive time triggered actions do).
- Total View Time - Total view duration across all users (e.g. how much time of the video was watched overall). Does not distinguish about which part of a video was watched.
- Audience - Unique viewers as determined by the user ID token (either the auto-generated randomized one or one given explicitly).

Experience Stream
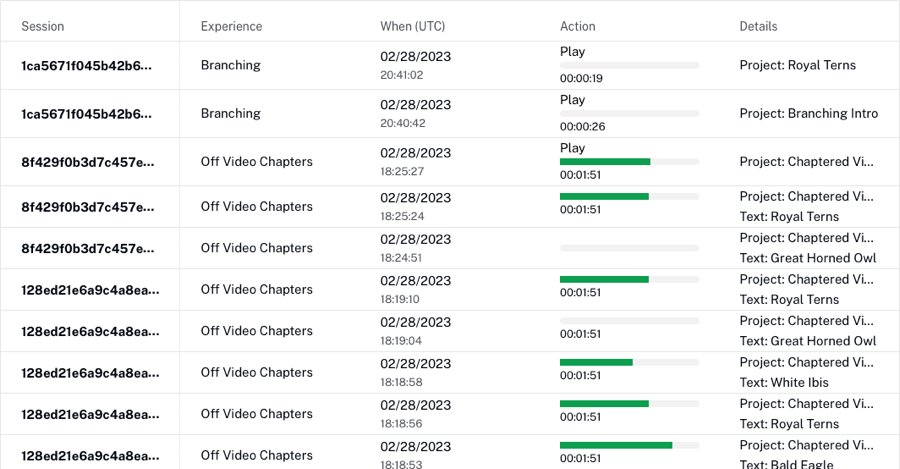
The Experience Stream report displays one row per action. The report includes views of bookmarks, user interactions with player controls, annotations and widgets. Progress events are excluded. The report will display:
- Session - Session ID
- Experience - Experience title
- When - When the action occurred
- Action - Action that occurred
- Details - Project or annotation that was interacted with
Poll Widget Detail
The Poll Widget Detail report will display one row per poll submit event. The report will display:
- Session Start Time - Session date and time (UTC time)
- Play Session - Play session
- User - Randomized user ID assigned by Brightcove Interactivity. The ID is assigned the first time user accesses interactive content. Token is valid for 1 year.
- Annotation ID - Annotation ID
- Project ID - Project ID
- Poll Type - Type of poll
- Prompt - Poll question asked
- Response - Response to the poll

Poll Widget Summary
The Poll Widget Summary report will display one row per Poll widget response value with a count of the responses. The Project ID column will contain a list of all projects where the poll appeared and was submitted. This is included to support templates where the same poll widget will appear with multiple projects. The Project IDs list is not de-duped. The report will display:
- Annotation ID - Annotation ID
- Project ID - Project ID
- Poll Type - Type of poll
- Prompt - Poll question asked
- Response - Response to the poll
- Answers Receive - Number of users who selected the response

Project Summary
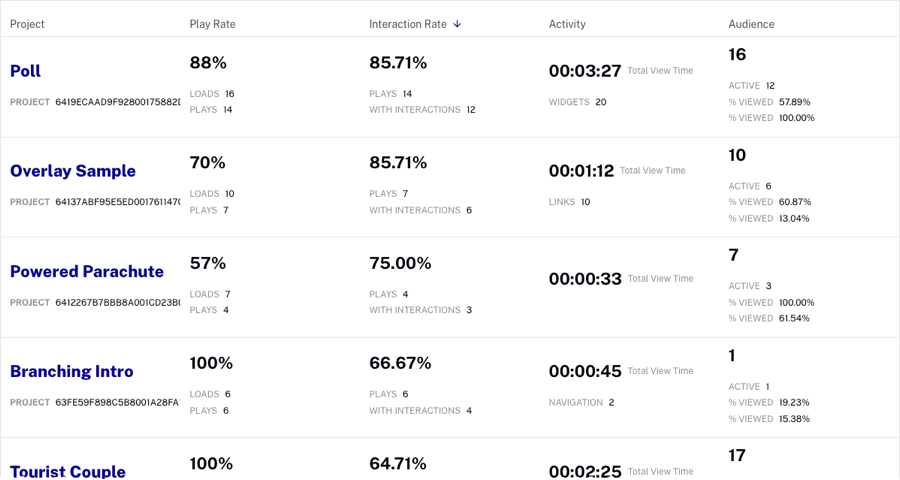
The Project Summary report displays aggregate performance data across all users for each project. Each row in the report is a separate project. The report will display:
- Project - Project title and ID
- Play Rate - Number of plays divided by the number of times it was loaded and ready for playback
- Interaction Rate - Plays with interactions divide by number of plays
- Total View Time - Total view time spread across all of the viewers
- Audience - Active audience is the number of viewers who click an interactive element, passive audience is the number who do not. % viewed of each is the media % viewed by each segment with the passive % viewed discounting any people who load the video but never play it.
User Summary
The User Summary report is an aggregate summary of the overall behavior of each user across each project that they viewed. The report will display:
- User - Randomized user ID assigned by Brightcove Interactivity. The ID is assigned the first time user accesses interactive content. Token is valid for 1 year.
- Time Watched - Total time watched across all videos
- Last Session - Last session date and time (UTC time)
- User Details - Number of times each kind of functionality was used
- Links - Text, image and transparent overlays
- Navigation - Chapters or overlays with jump to time functionality
- Responses - Quizzes
- Widgets - Standard widgets
- Videos - Number of unique videos played
- Play Details
- Plays - Number of video plays
- Sessions - Number of times a video was loaded and ready for playback (not necessarily played)

User Activity Stream
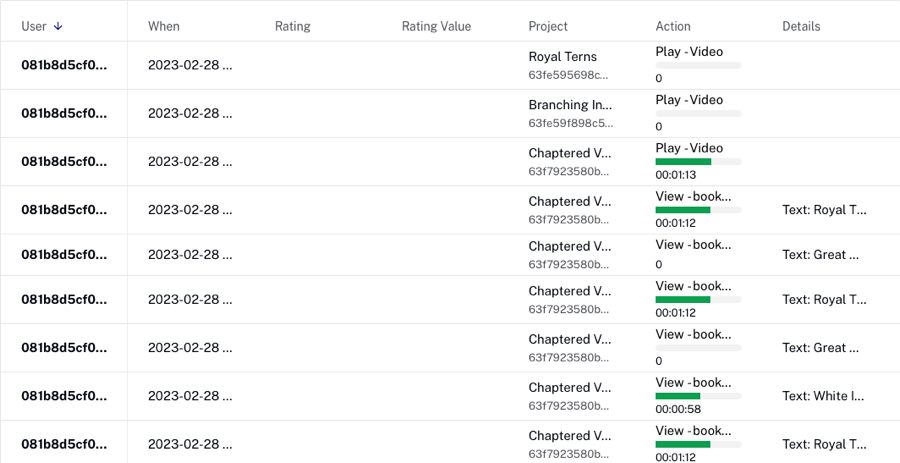
The User Activity Stream report shows an event-by-event rundown of each action a viewer has taken in a project. For example, each time a bookmark is clicked, link is clicked, quiz responded to, video ended, all these events are tracked in this report. Progress events are excluded. The report will display:
- User - Randomized user ID assigned by Brightcove Interactivity. The ID is assigned the first time user accesses interactive content. Token is valid for 1 year.
- When - Date and time the action took place (UTC time)
- Rating - Icon rating from the User Sentiment widget (thumbs up, down)
- Rating Value - Rating value from the User Sentiment widget regardless of which icon type is used (1, 3, 5)
- Project - Project title and ID that was acted upon
- Action - Lists the specific action that was taken (i.e. play events for a video, clicks on links, quiz responses, chapter markers clicked) and the time in the video of the action. Video events:
- Final - Video - Stopped watching (video abandonment, closed browser tab or closed browser during playback)
- Video End Under - Reached end of video but watched under the total length of the video (skipped ahead or branched out of the video)
- Video End Over - Watch more than the total time of the video (skipped back, looped)
- Video End Complete - Whole thing start to finish
- Details - Gives additional context for annotations (i.e text of bookmark that was clicked, external URL opened, custom code, question text and answers recorded)
- Annotation ID - Annotation ID that the action occurred on
User Sentiment Summary
The User Sentiment Summary report shows the results of the user summary widgets. The report will display:
- Project - Project name
- Project ID - Project ID
- Video Source ID - Video ID
- Plays with Rating - Number of plays where a rating was given
- Median Rating - Median rating
- Plays with Max Rating - Number of plays where the max rating was given
- Plays with Min Rating - Number of plays where the minimum rating was given

