
Introduction
Undoubtedly you will want to know what viewers are watching in your Brightcove Beacon apps. To accomplish this you will use Google Analytics. Brightcove will load a customized Dashboard and a customized Google Data Studio report into your Google Analytics account. Both of these tools provide great insight into how your customers are using your Brightcove Beacon apps.
In addition to the customized dashboard and report, you can use the standard analytics tools in Google Analytics to view customer behavior. You can use the standard analytics data gathered by Google, and in addition Brightcove adds other entities to use, detailed later in this document. For instance, Movies events are dispatched when a movie is played, a default Google analytics measure, and time watched is calculated, a measure added by Brightcove. Therefore, in Google Analytics you can see the "most watched" movies by both how many times viewers played the movie and total time watched. These entities added by Brightcove are used extensively in the customized dashboard and report mentioned in the previous paragraph.
Viewing the Dashboard
To view the Google Analytics Dashboard installed by Brightcove, and more importantly the data the dashboard displays, follow these steps:
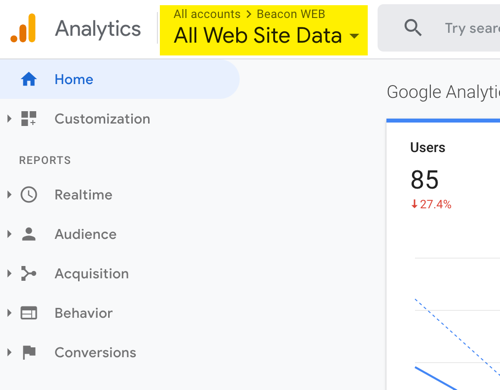
- Log in to Google Analytics.
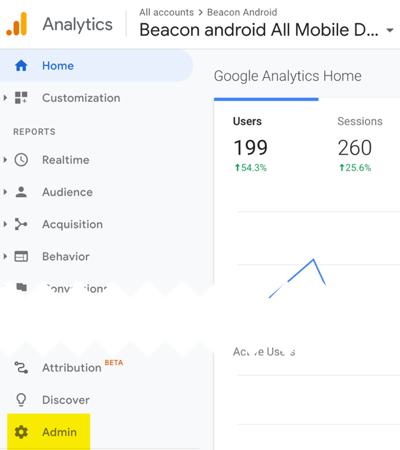
- Click on the dropdown (highlighted in yellow in the screenshot) to see all your Google Analytics accounts.
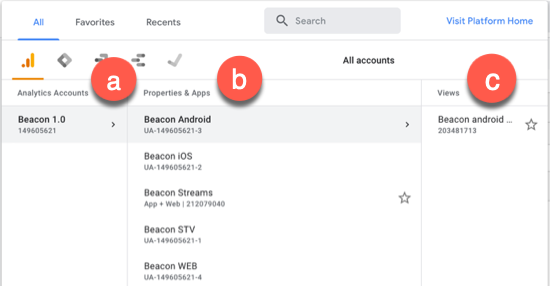
- From the three-paneled dropdown, select:
- Your Brightcove Beacon account
- Your app for which you want analytics
- Your view (you will only have one view per app)
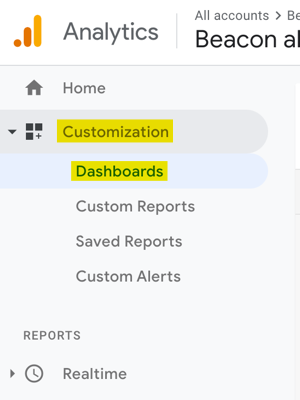
- In the left side navigation, click on the Customization option, then on Dashboards to see the customized dashboard for your current view.
- If the Dashboard does not appear, you will need to select it from the list:
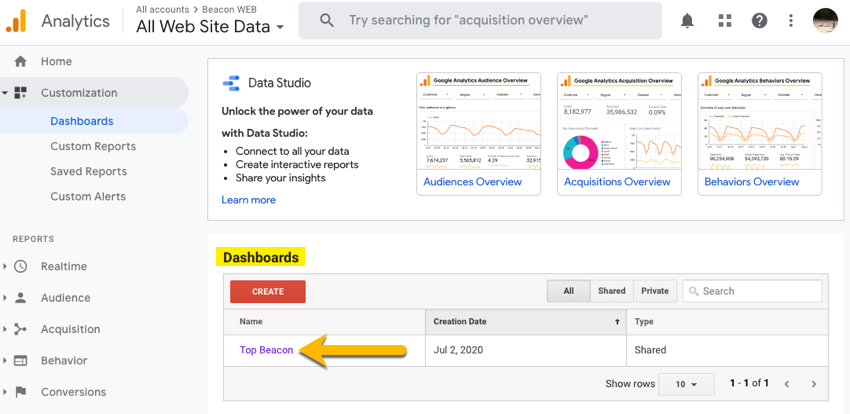
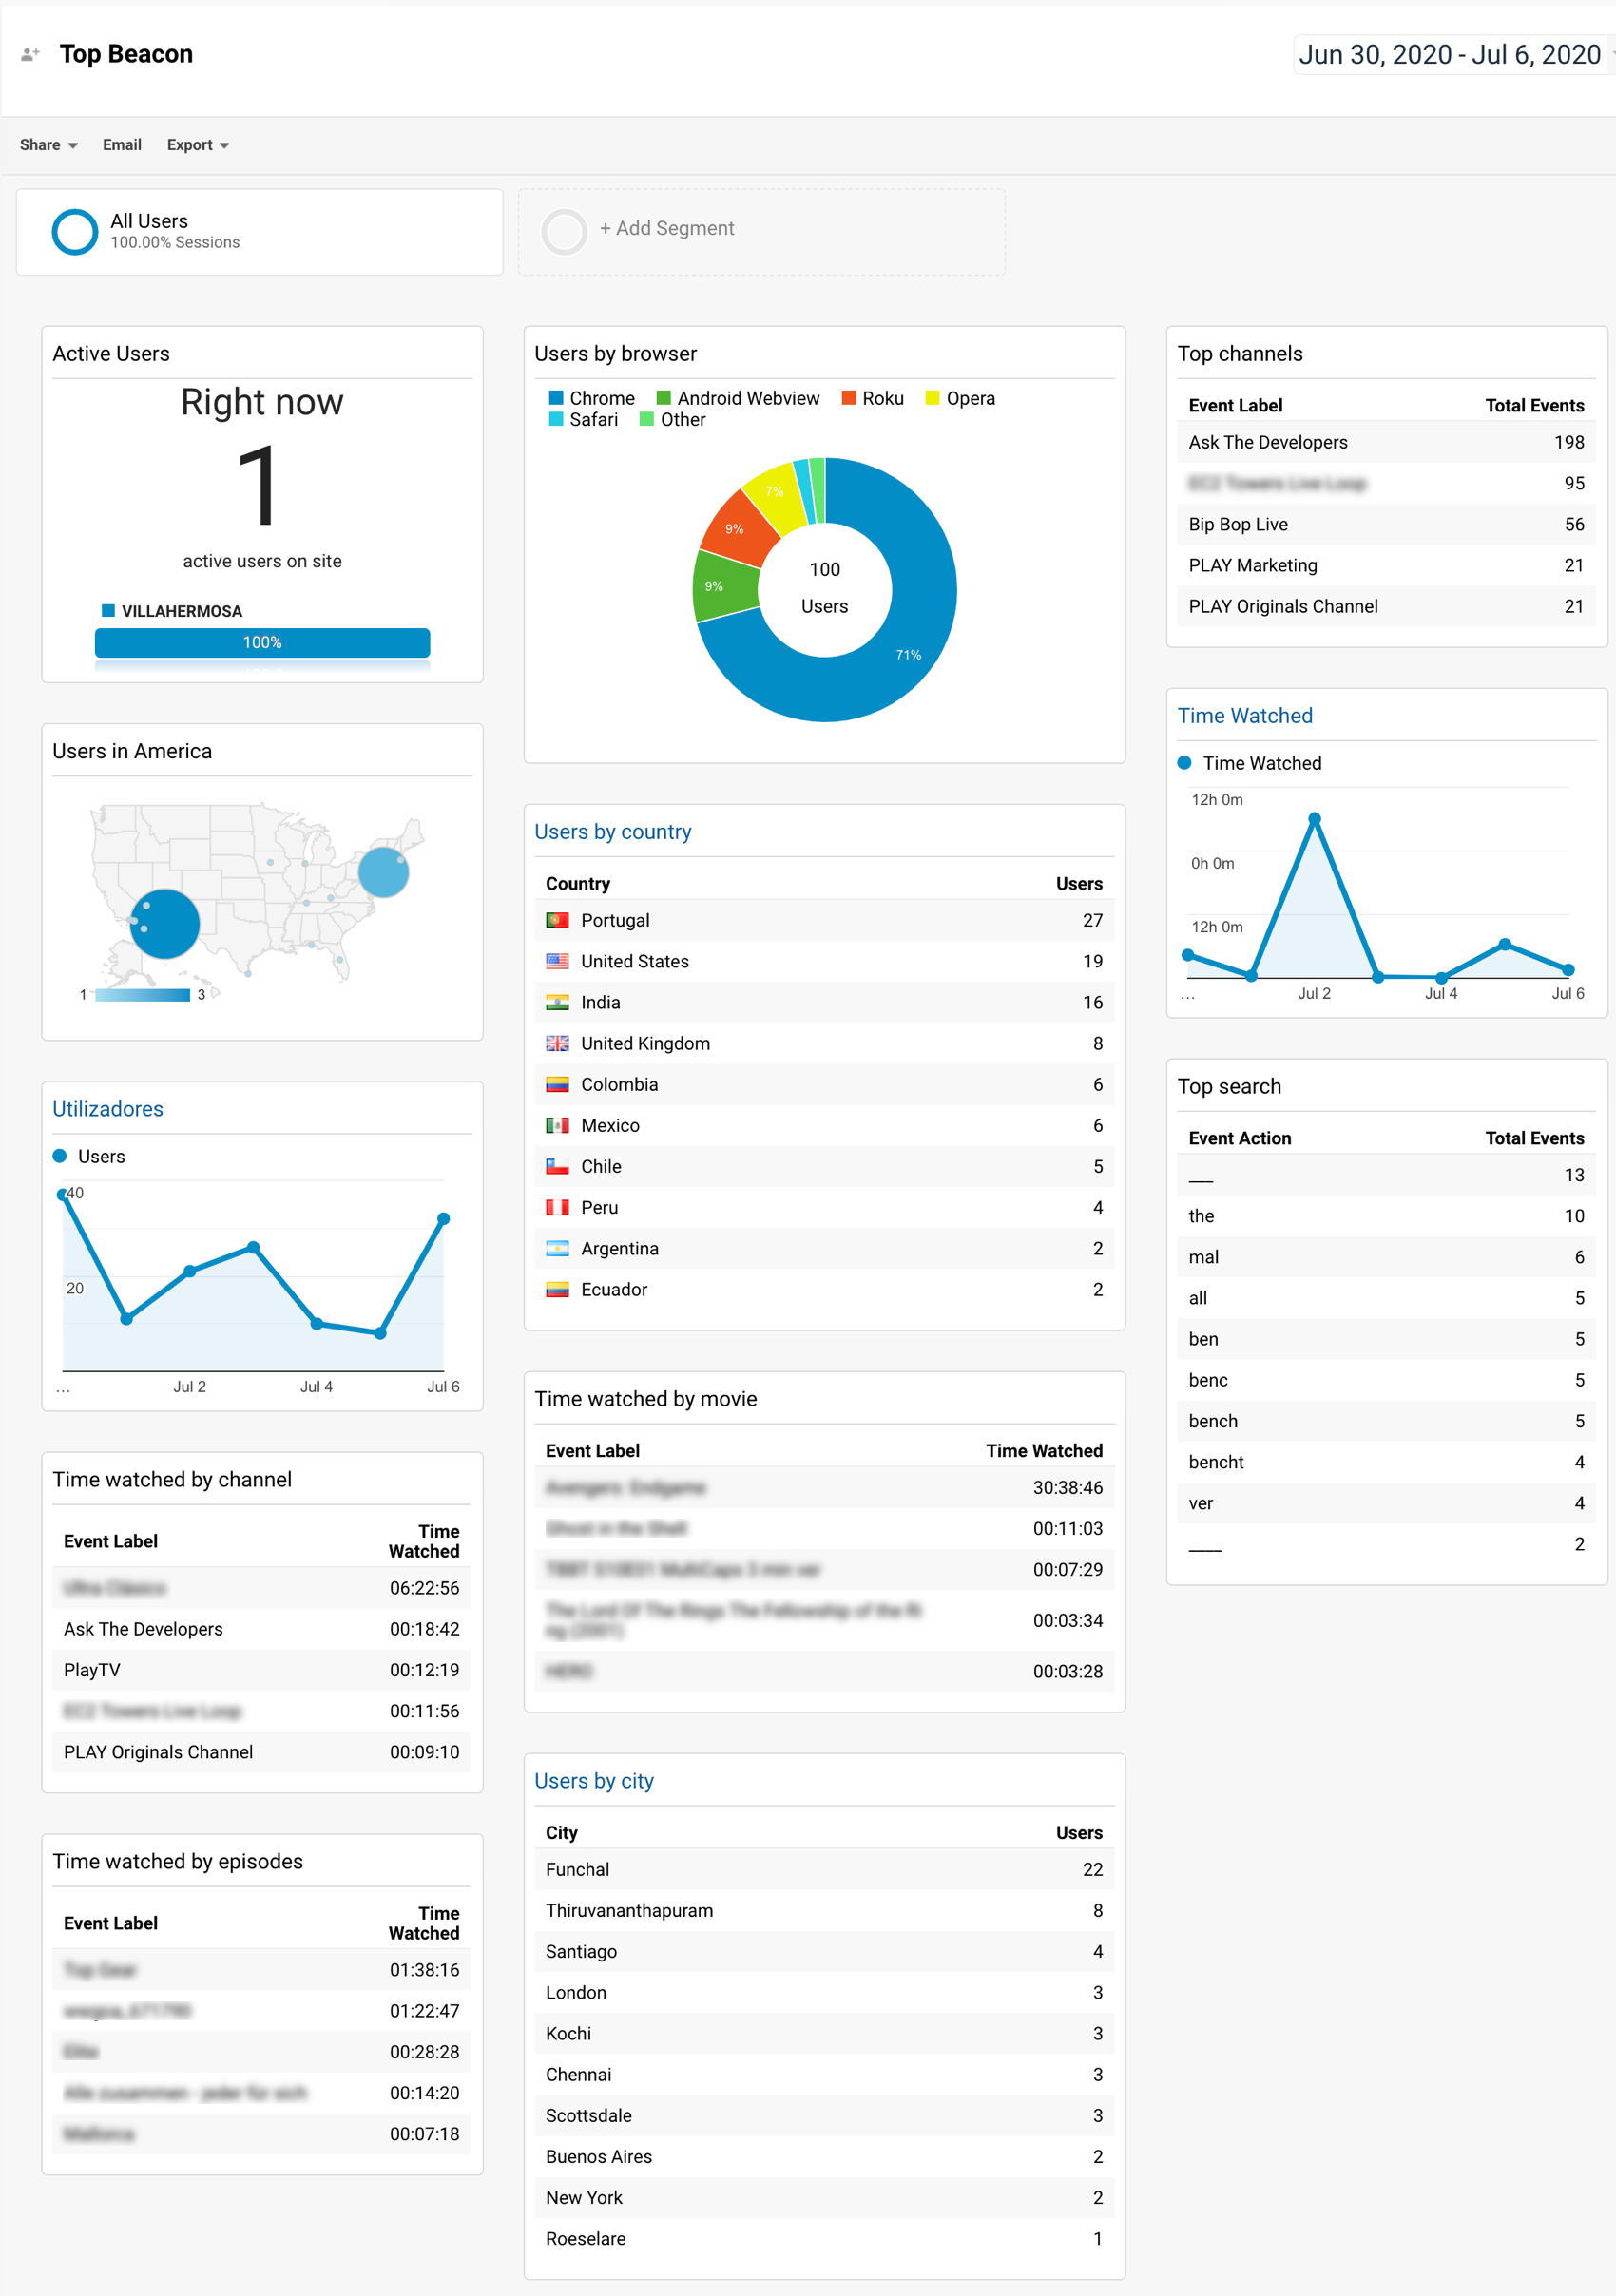
- Your dashboard will appear on the right side of the screen. A sample dashboard is shown here:
Viewing the Data Studio report
According to Google: "Data Studio is a free tool that turns your data into informative, easy to read, easy to share, and fully customizable dashboards and reports."
To view the customized Google Data Studio report installed by Brightcove, follow these steps:
- Log in to Google Data Studio (datastudio.google.com).
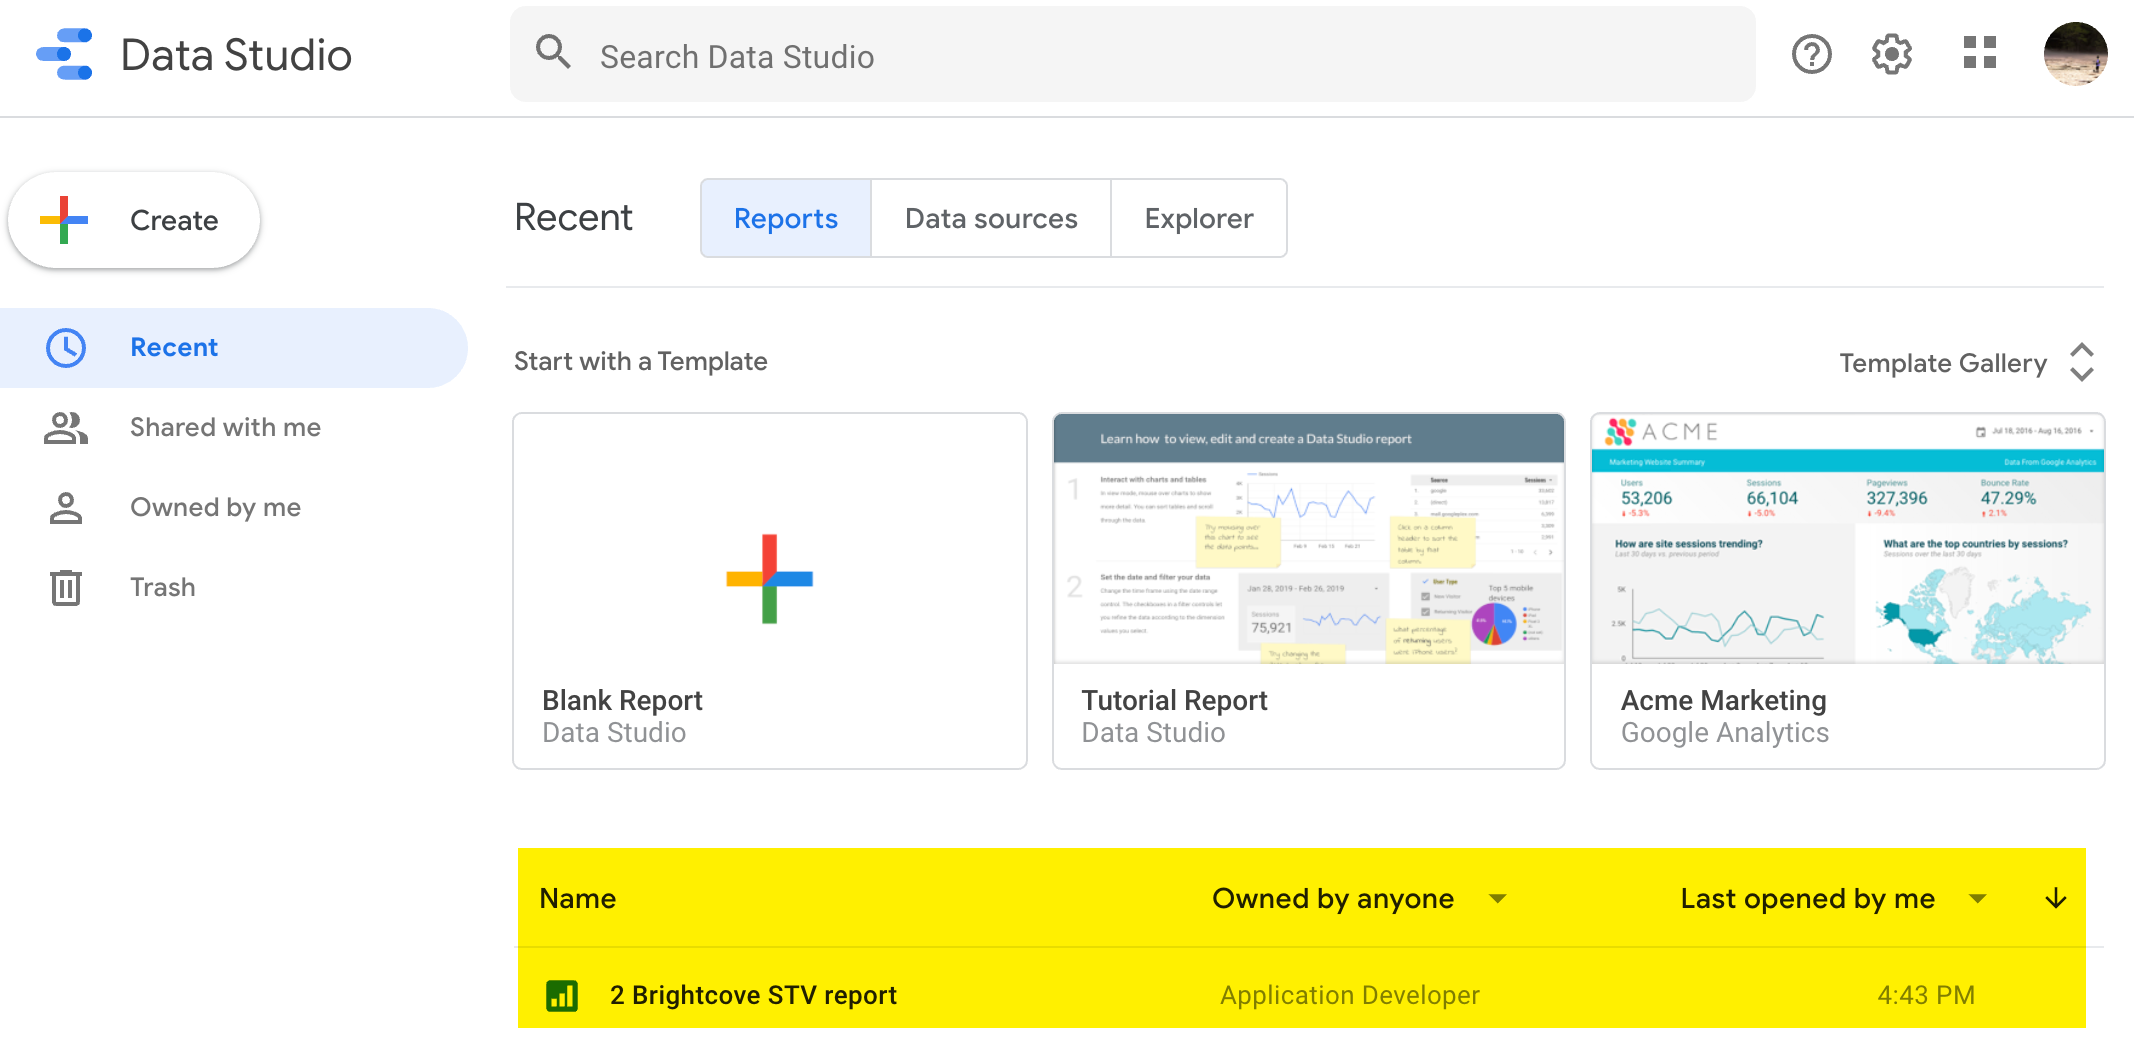
- You will see a list of report(s) listed on the landing page (highlighted in yellow):
- Click on the report name to open it.
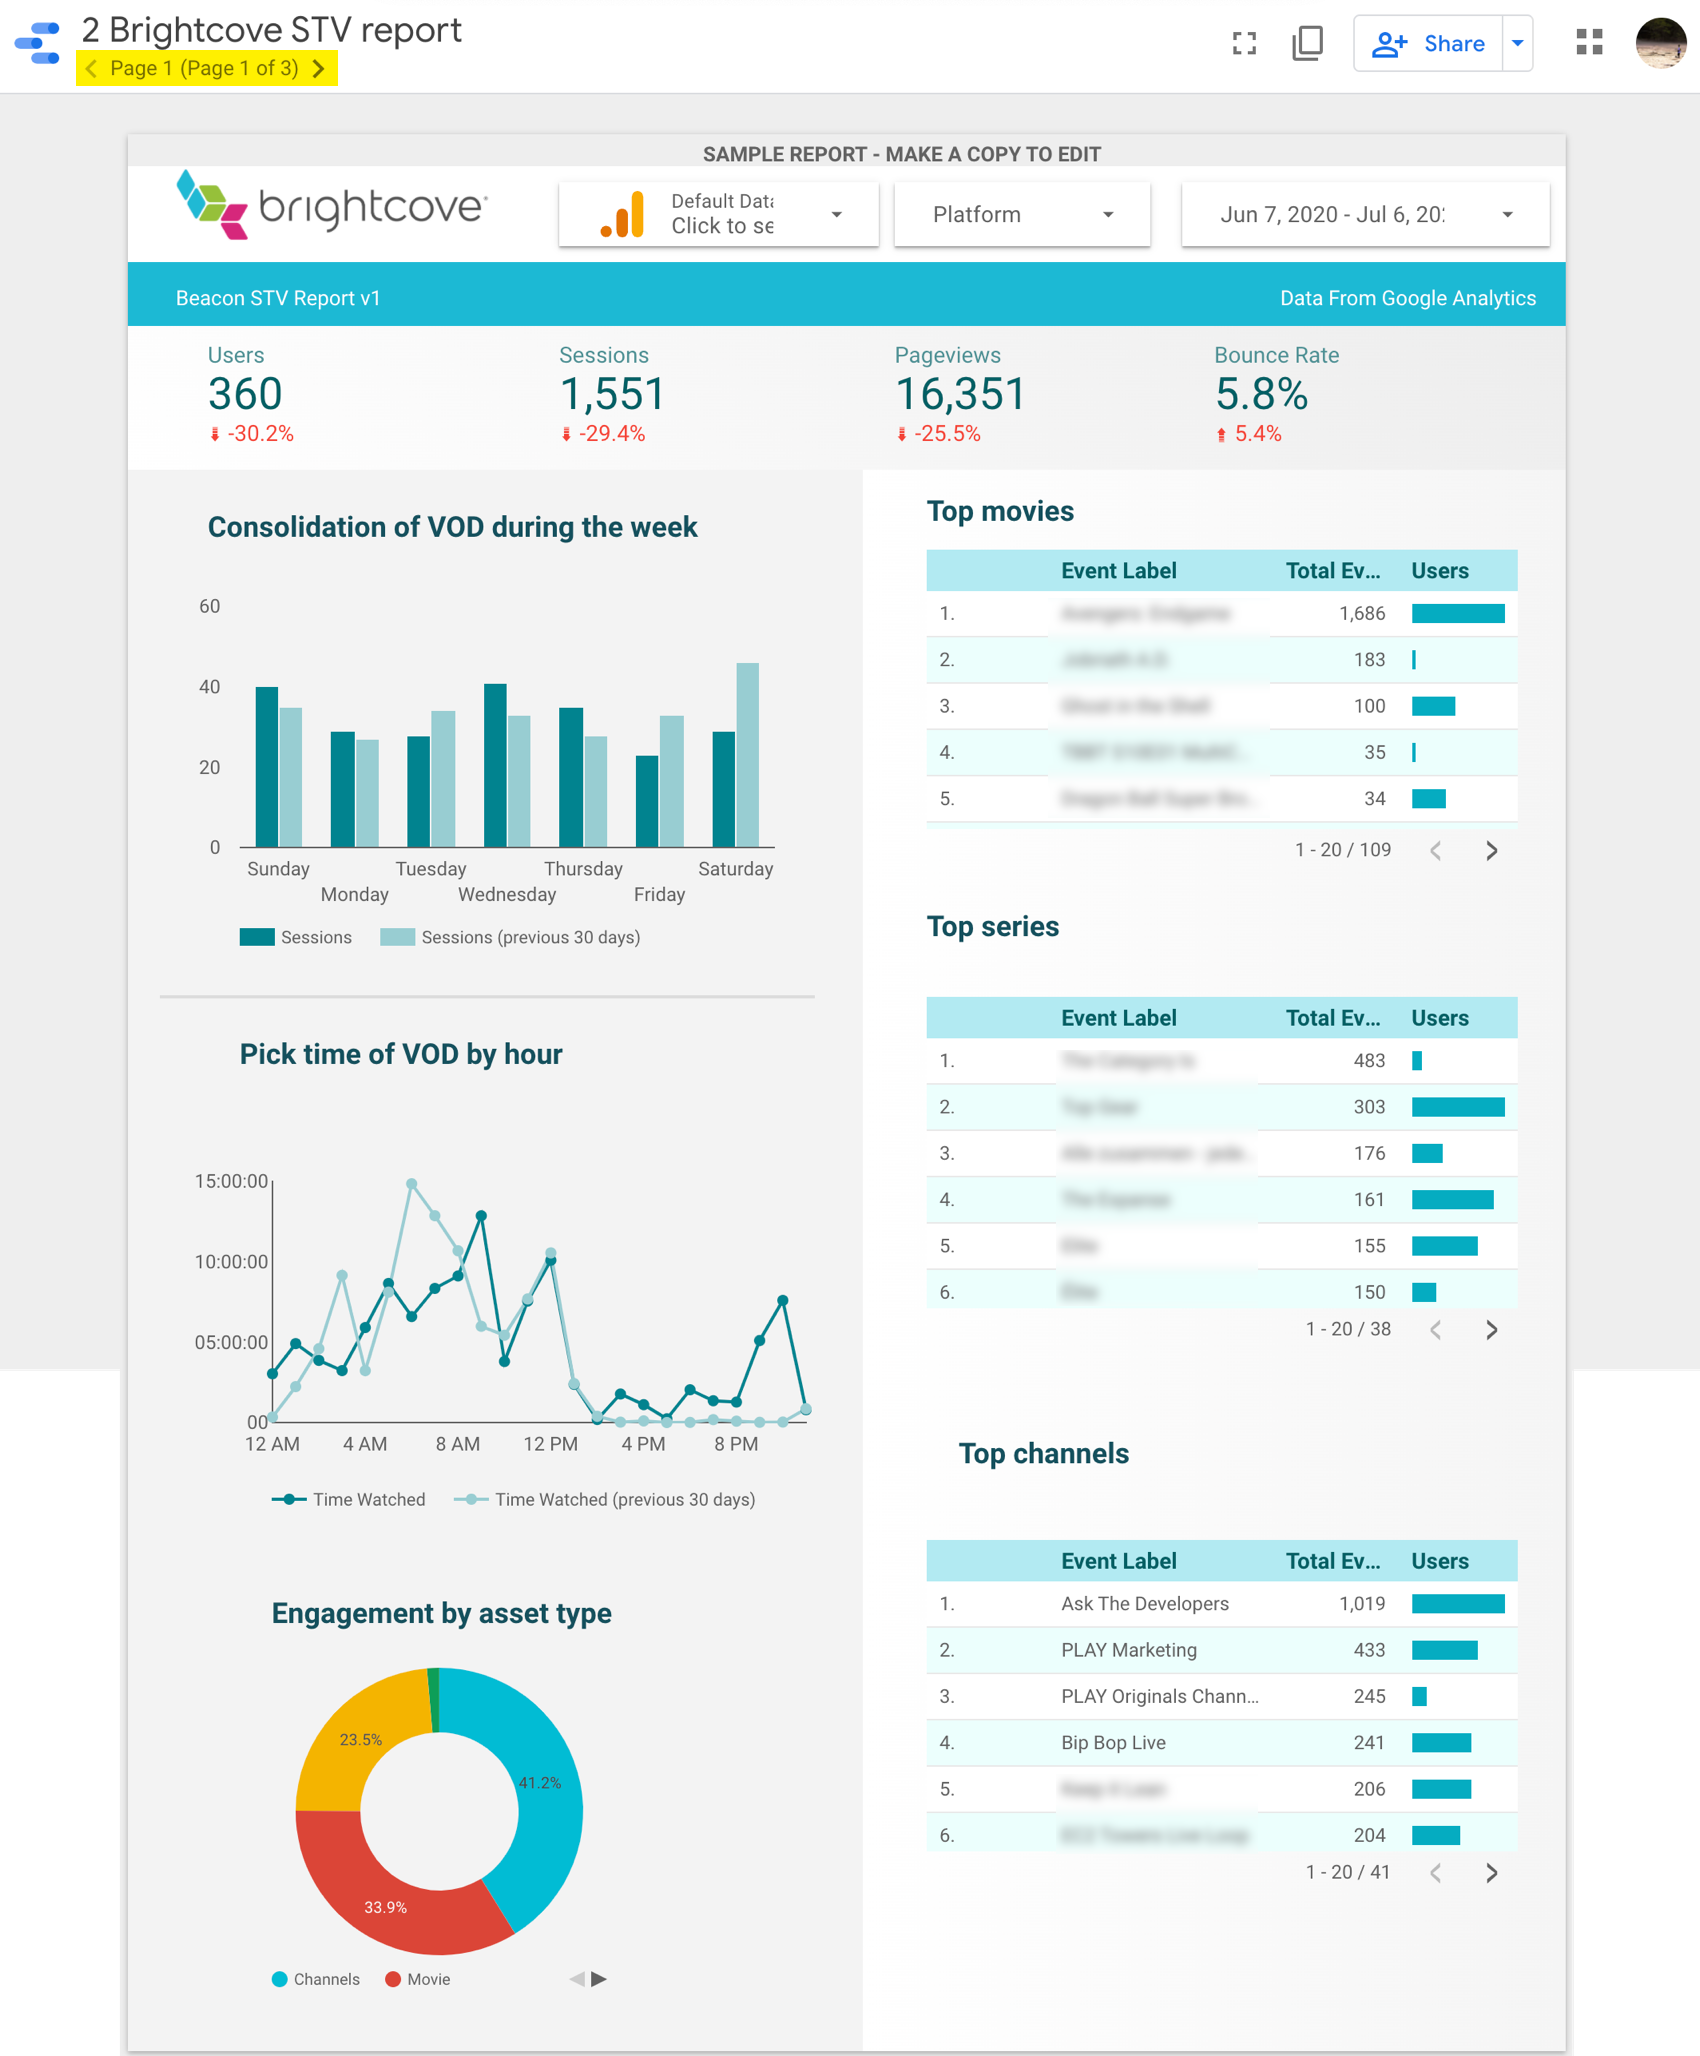
- The first page of an example report is shown here. Note in the top left corner of the report is the navigation (highlighted in yellow) to see the other pages.
Viewing dimensions and metrics
Brightcove adds functionality to the default Google measures for your analytics reports. You can use the default Google Analytics dimensions and metrics, the building blocks of analytics reports, as well as numerous dimensions and one metric added by Brightcove. These additional dimensions and the one metric are used in the dashboard and Data Studio report shown in the first two sections of this document.
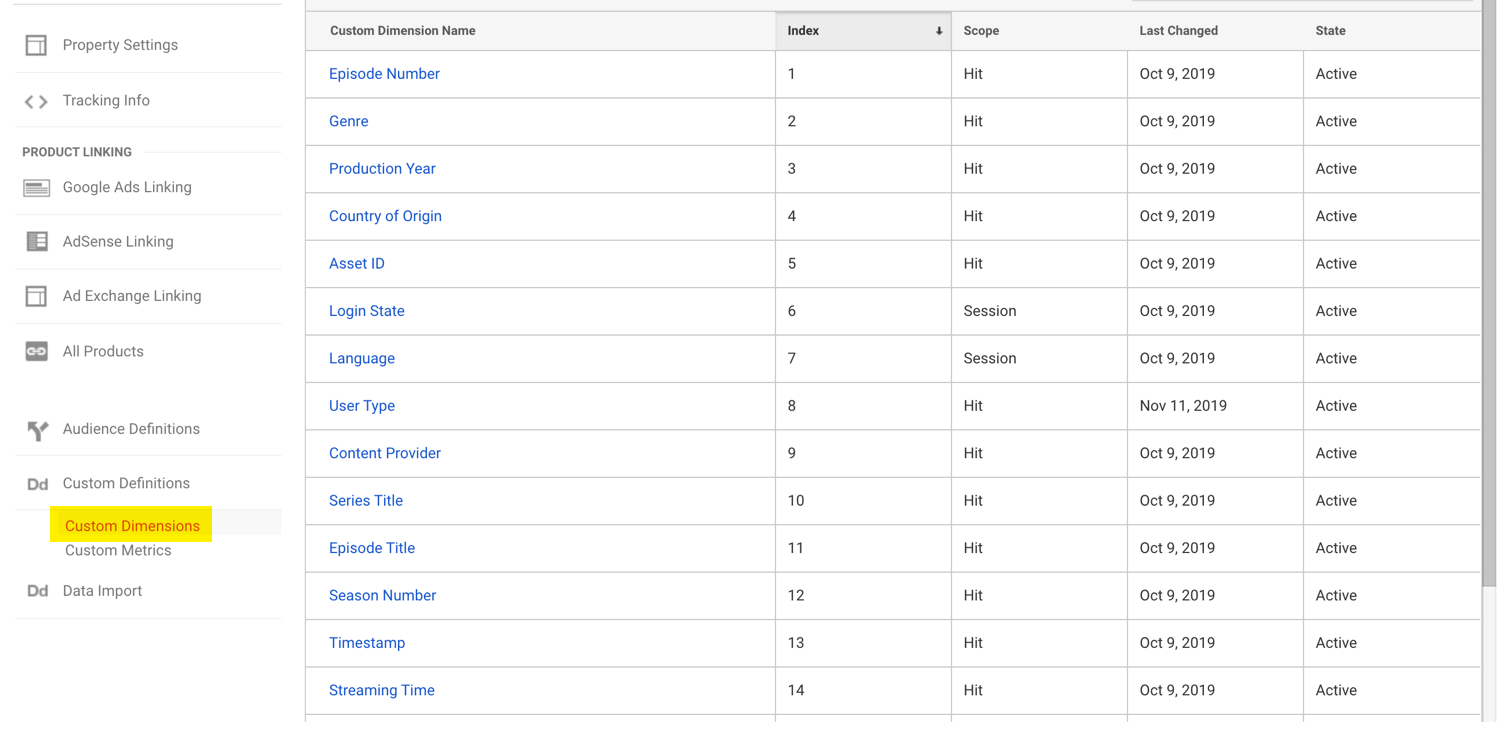
Note that the dimensions and metric added by Brightcove are NOT the same for each type of Brightcove Beacon app. For instance, the iOS mobile data has 16 custom dimensions added, whereas the web site app has 20 custom dimensions added. To see a list of the dimensions and metric in the Google Analytics UI, follow these steps:
- Log in to Google Analytics.
- Click on the dropdown (highlighted in yellow in the screenshot) to see all your Google Analytics accounts.
- From the three-paneled dropdown, select:
- Your Brightcove Beacon account
- Your app for which you want analytics
- Your view (you will only have one view per app)
- In the left side navigation, click the Admin option.
- Click Custom Definitions.
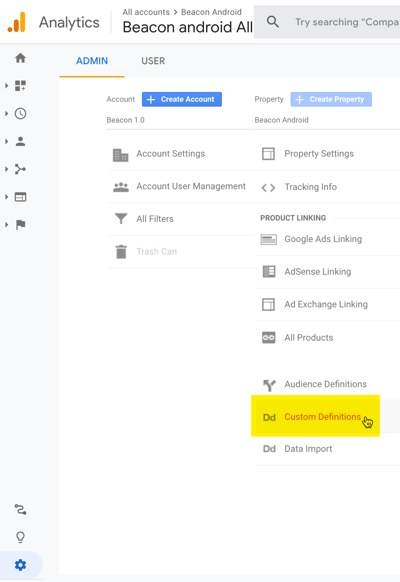
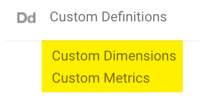
- When you click Custom Definitions you will see links for Custom Dimensions and Custom Metrics.
- Click the Custom Dimensions link to see the dimensions for this app. Dimensions change per app.
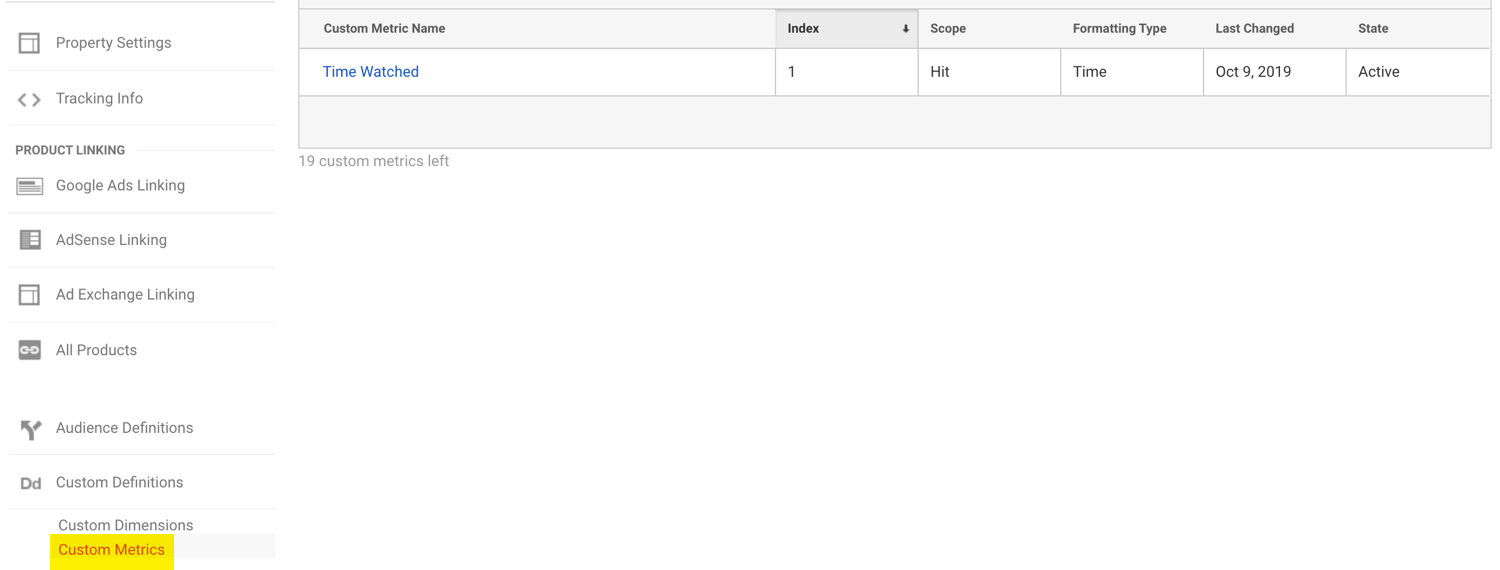
- Click the Custom Metrics link to see the single metic, Time Watched. This is the only custom metric for Brightcove Beacon apps.
Report examples
This document is to make you aware of information you can use from Google Analytics. It is NOT the intention of this document to be a complete instructional guide on how to use Google Analytics with your Brightcove Beacon apps. That being said, the next section of the document will detail how to see a few commonly requested reports about your Brightcove Beacon apps.
Audience information
You can view analytics on your audience by following these steps:
- Choose your app/view by following the first three steps from any of the sections above.
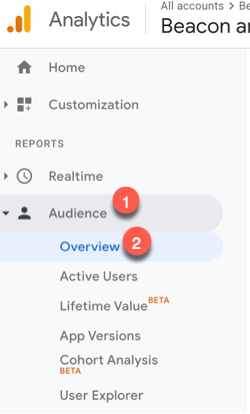
- In the left side navigation, first click Audience then Overview.
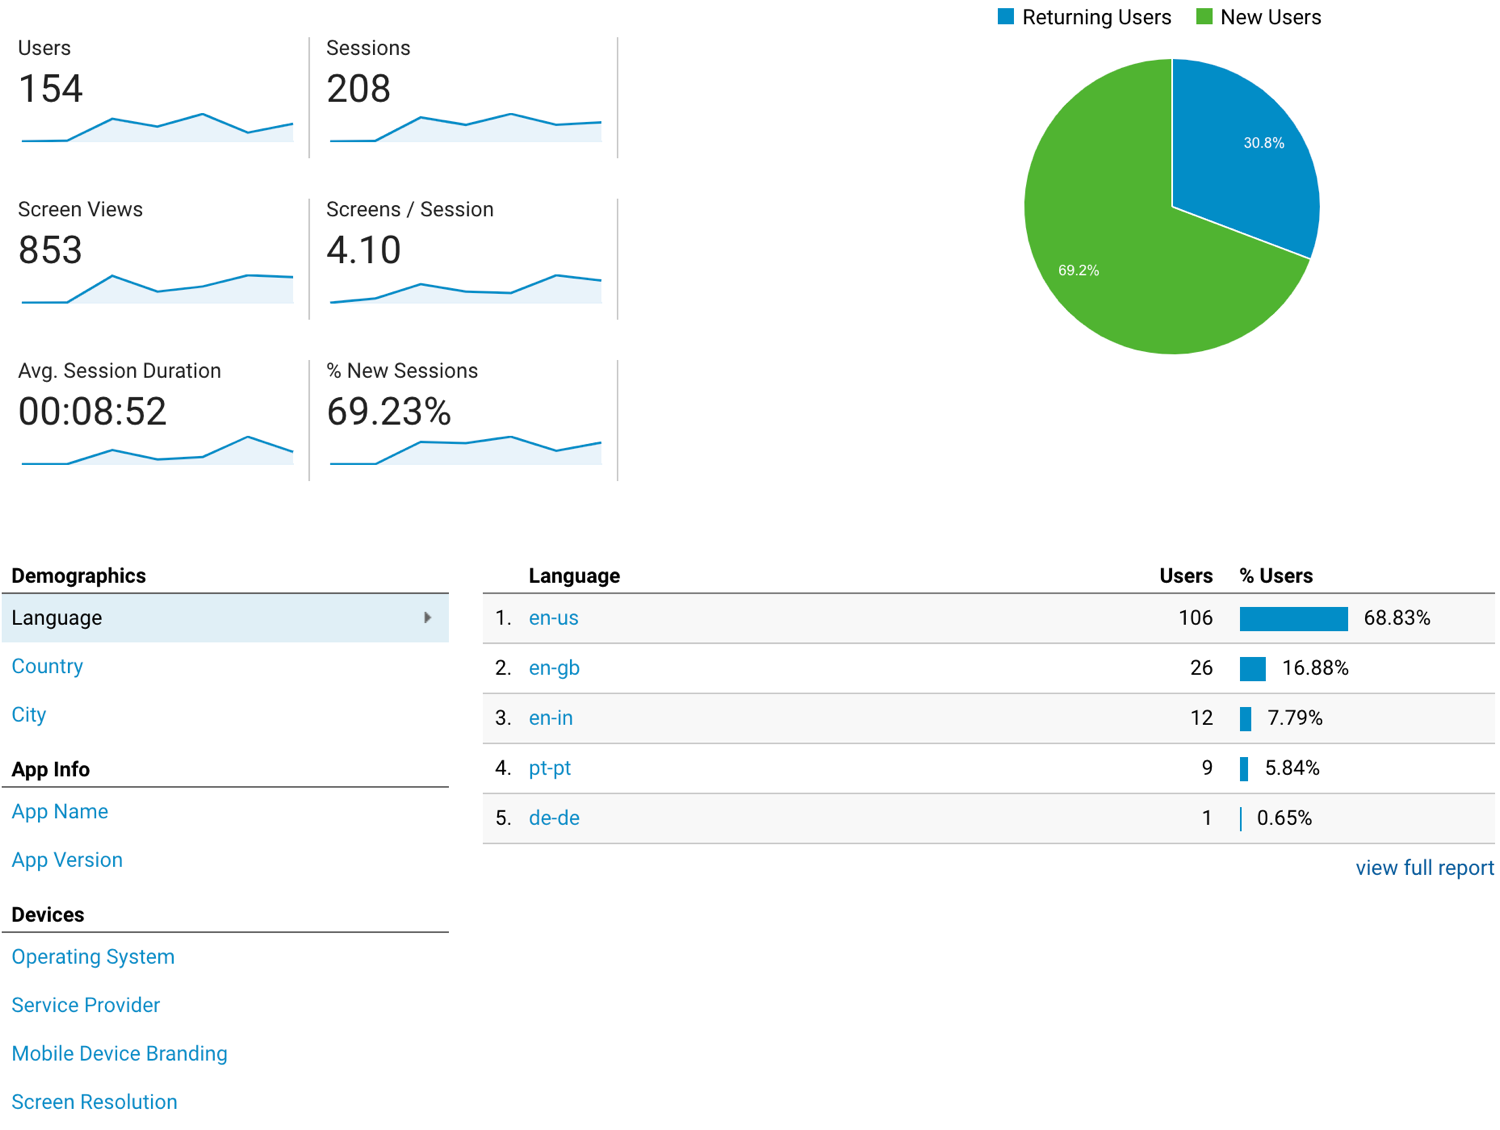
- On the right side of the screen, you see a summary of your audience using different metrics like Language, App Info, and Devices. You can click on a specific metric for more detail.
Screen views information
Of course, you will want to see what your viewers are doing in your apps. The option for this is Behavior. Follow these steps to see screen views information:
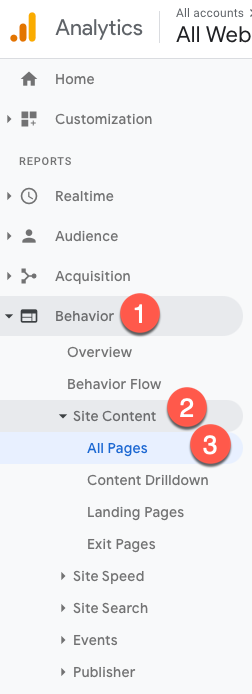
- In the left side navigation, click Behavior → Site Content → All Pages.
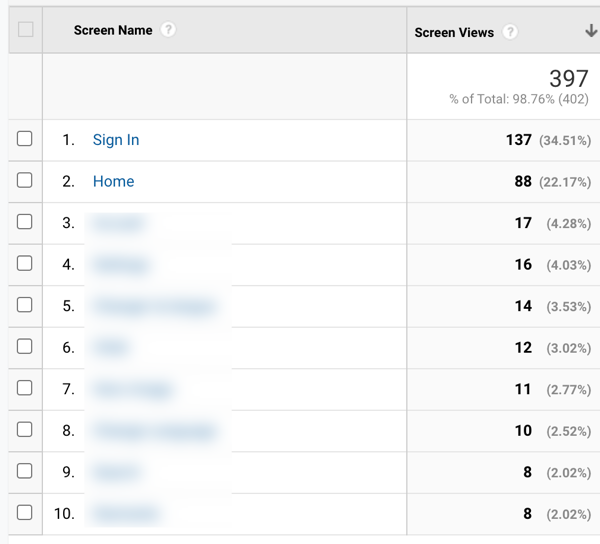
- On the right side of the screen you see a list of the most viewed screens.
Played and time watched information
Still in the Behavior option, you can see the number of times a video asset has had the play button clicked for it, and also how long the asset was actually watched. Follow these steps for that info:
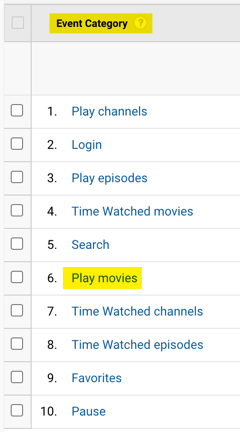
- While still in the Behavior option, click Events → Top Events.
- In the Event Category list, click Play movies
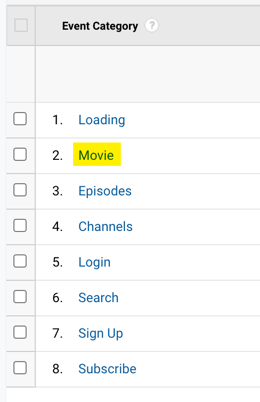
- In the Event Category list, click Movie.
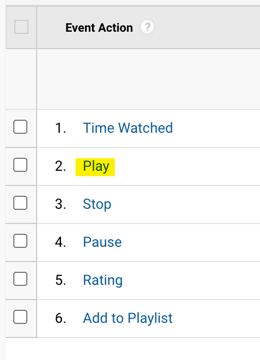
- In the Even Action list, click Play.
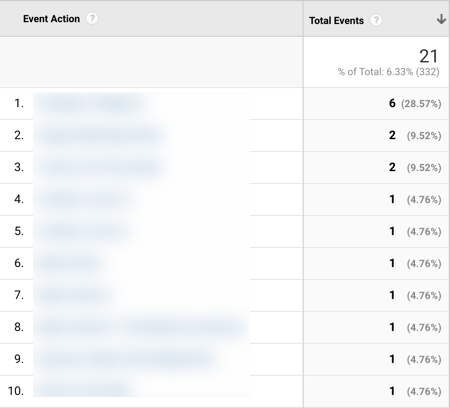
- Note that the list shows the number of times the play button was click for each asset.
- Note that you can see information on one or more of your custom dimensions by adding the appropriate column to the table. To do this, click the down arrow for the Secondary dimension dropdown, where you can see the Custom Dimensions group.
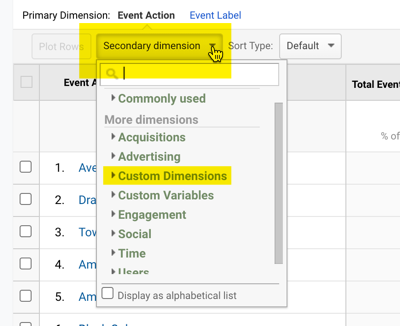
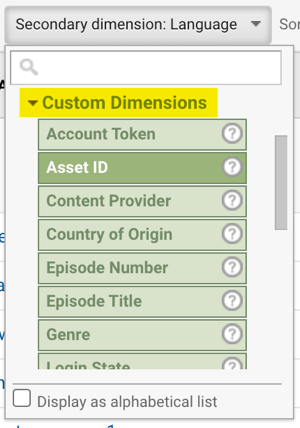
- You can now open the Custom Dimensions group and select a dimension.
- View the example table with the Genre custom dimension added.
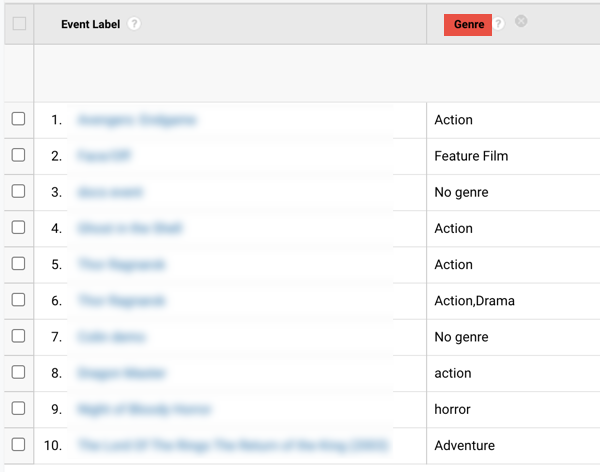
- Note the in the Event Action list you can also see Time Watched, which of course uses your custom metric Time Watched.
Google Analytics learning resources
You have just scratched the surface of Google Analytics in this document. You can put together custom reports with daily or weekly summary information on selected assets, etc. A good place to start your journey of learning more about Google Analytics could be the Google Analytics Academy and/or the Google Analytics documentation.